
On the 20th-Anniversary of the very popular NDX 100 ETF (QQQ), it finds itself working on a what could be an important breakout level!
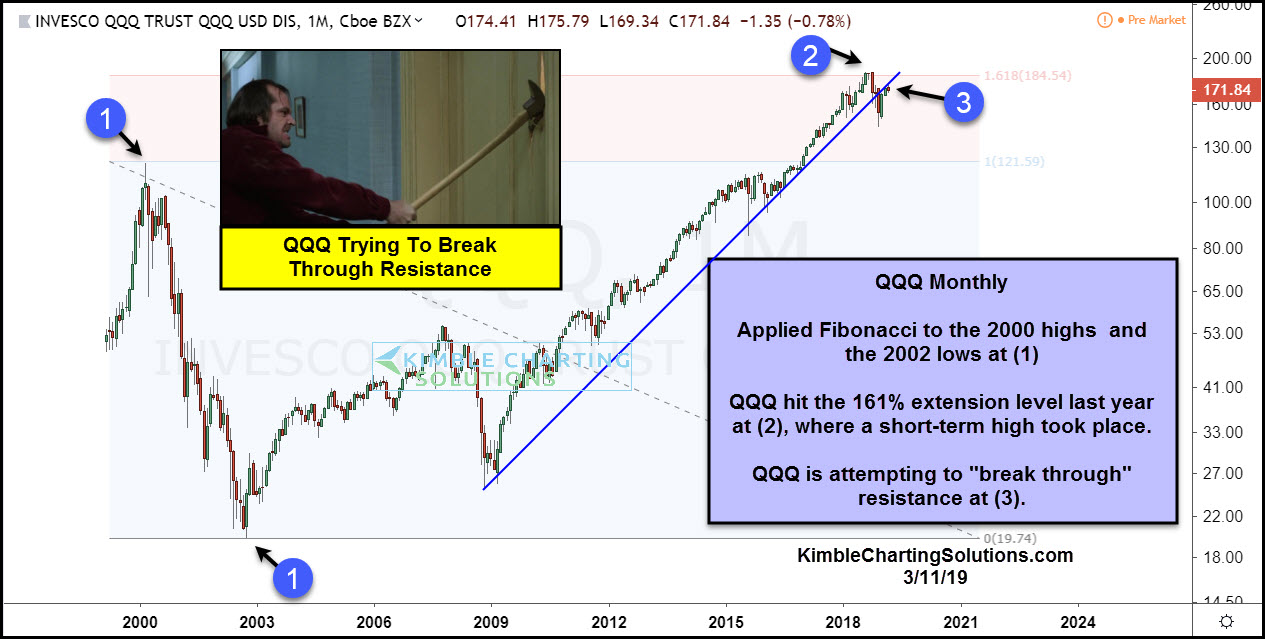
This monthly chart of QQQ applied Fibonacci extension levels to the 2000 highs/2002 lows at each (1). The rally off the 2002 lows saw it reach its 161% extension level last fall at (2), where it created a short-term high and then proceeded to fall nearly 20%.
The rally over the past 10-weeks has QQQ testing the underside of 10-year support as resistance for the first time in history.
The long-term bull trend should be sent an important message by what QQQ does at this new test. The bull case for tech stocks wants/need to see a breakout at (3) and then another breakout above the 161% extension level to keep the long-term uptrend in play!
–
