
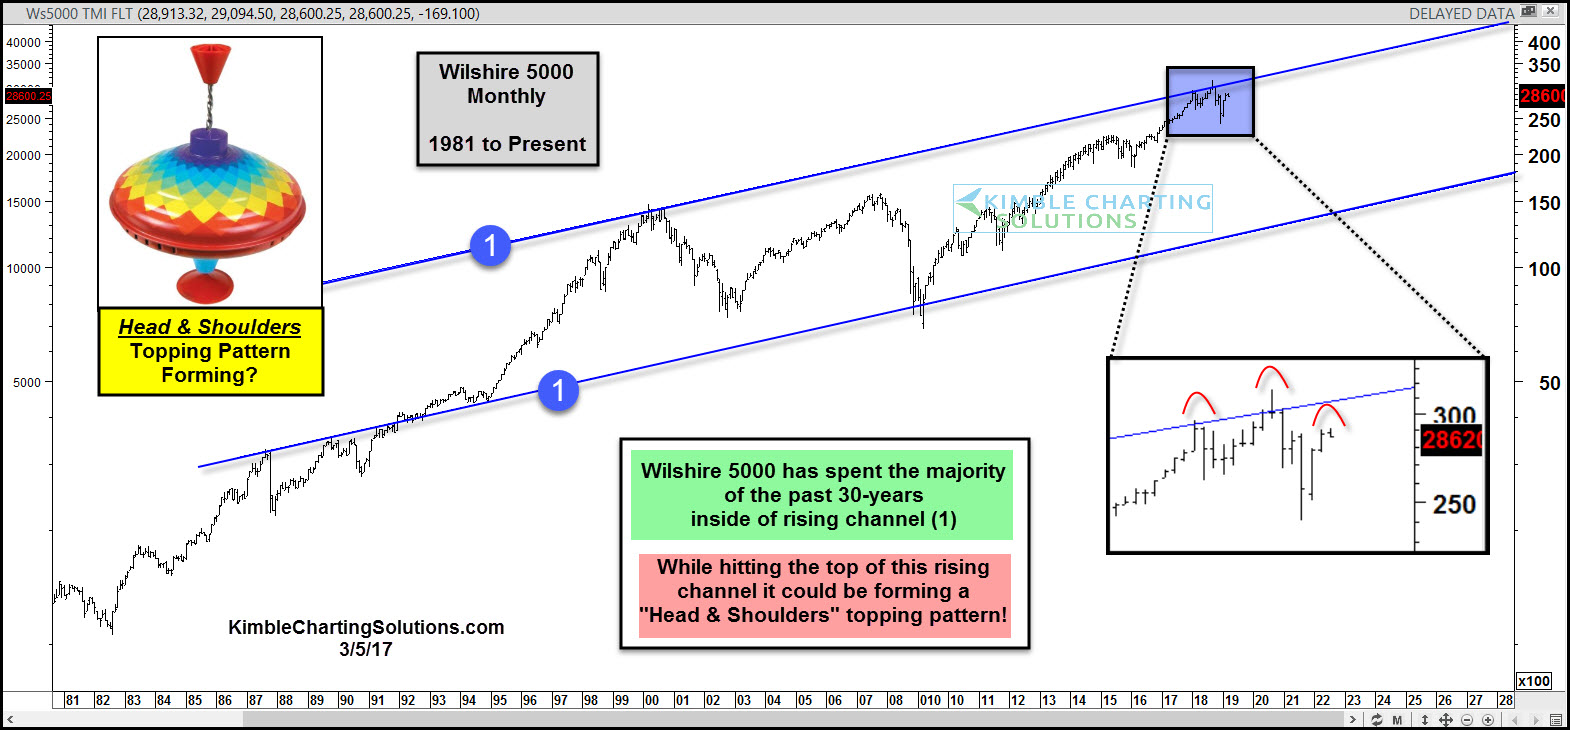
The Wilshire 5000 Index has spent the past 30 years trading within a bullish price channel up-trend – see (1) in today’s chart above. The price action of late has NOT broken the long-term bull trend.
Though the latest move off the 2009 lows has been bullish, and quite strong, it has taken the broad stock market index to the top of this bullish channel.
That alone is a reason for concern as this appears to be slowing the bull market down. But there’s more…
While hitting the top of the channel, the Wilshire 5000 has taken the shape of a “still forming” head and shoulders topping pattern.
All eyes on that potential right shoulder!
Long-term bulls do not want to see this broad stock market index forming a Head & Shoulders topping pattern right here as there is plenty of room to the downside. Stay tuned!
This article was first written for See It Markets.com. To see original post CLICK HERE
–
