
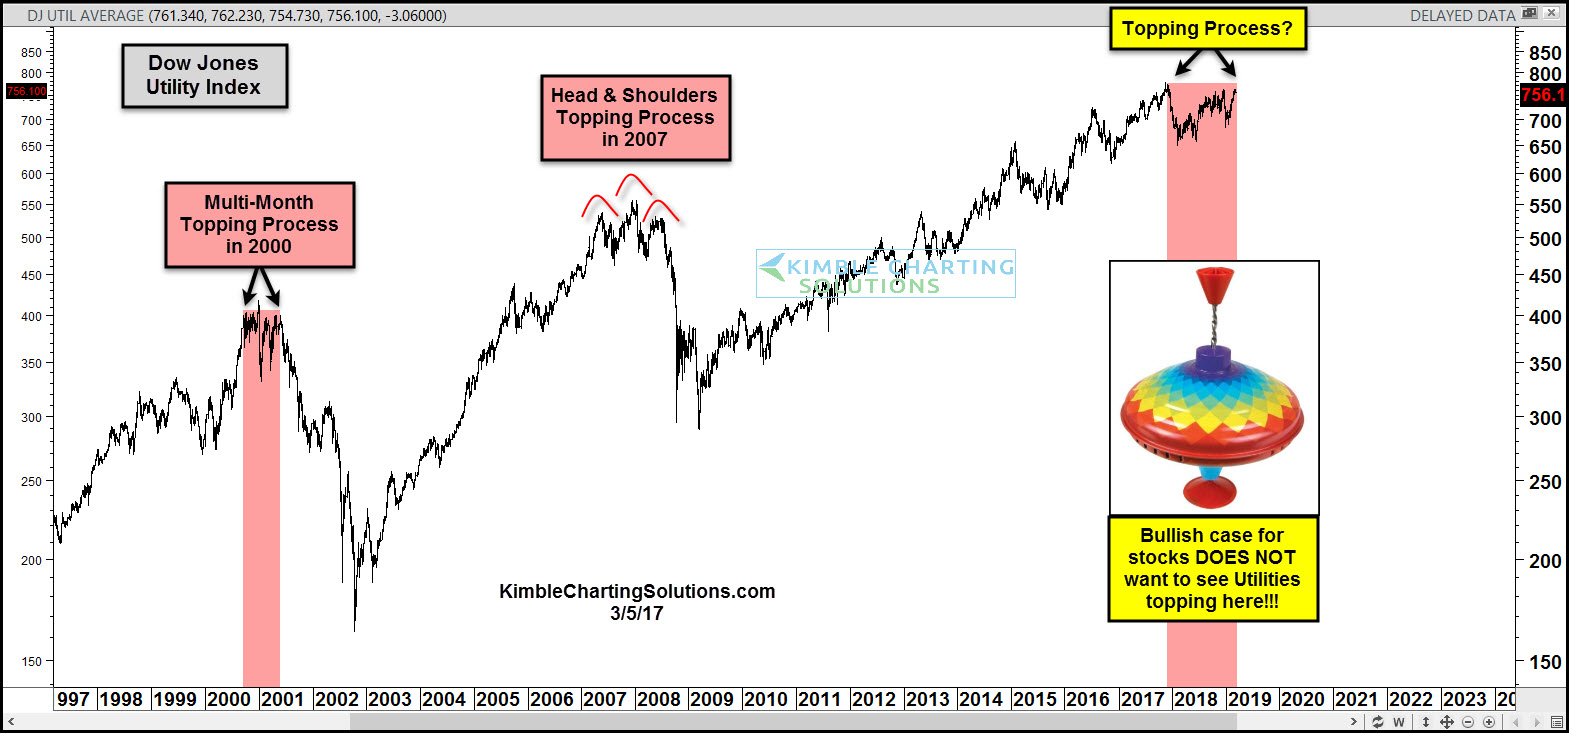
In 2000 the Dow Jones Utility index spent around 7-months creating a topping process. The S&P 500 had declined for nearly 12-months before the waterfall decline in Utilities got started.
In 2007, Utilities spent nearly 12-months creating a topping process. The S&P 500 had declined for nearly 9-months before the waterfall decline in Utilities got started.
The Dow Jones Utilities weekly closing all-time high took place in December of 2017. The index is currently around 1% below the 2017 highs.
Is it creating another important top or about to break out and send a positive message to the broad markets?
Below looks at the Dumb Money Confidence Level from Sentimentrader.com
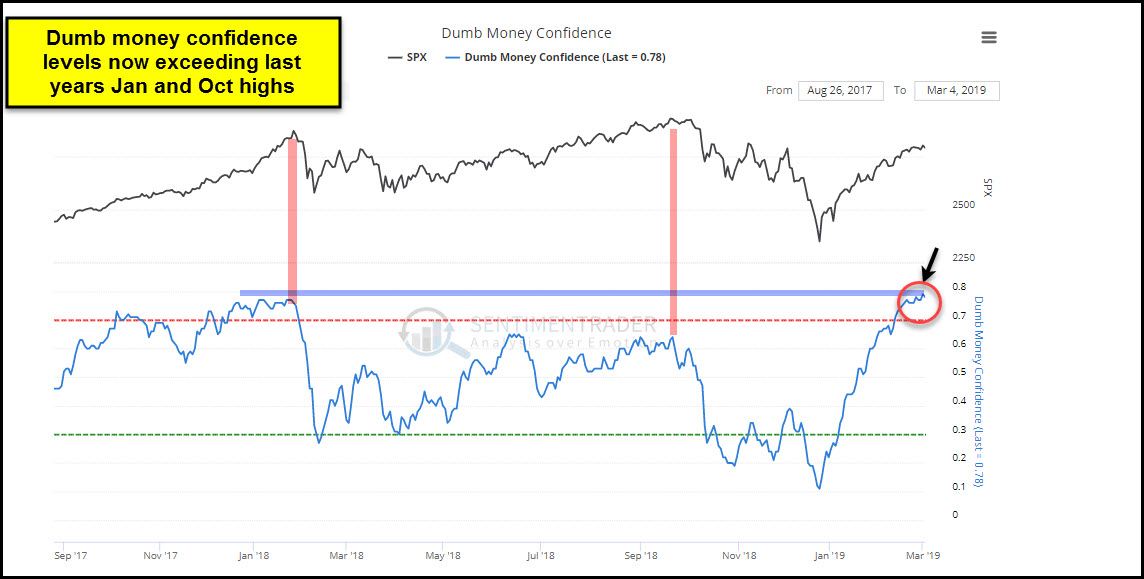
Dumb Money confidence is currently testing last years highs as Utilities are within 1% of the all-time highs.
In my humble opinion, what Utilities do the next few weeks as they test old highs, should send a very important message to the broad market! Keep a close eye Utilities the next 6-weeks friends!!!
–
