
Is India about to send a bullish message to stocks in the region or globally? A key test looks to be in play right now, that could answer this important question.
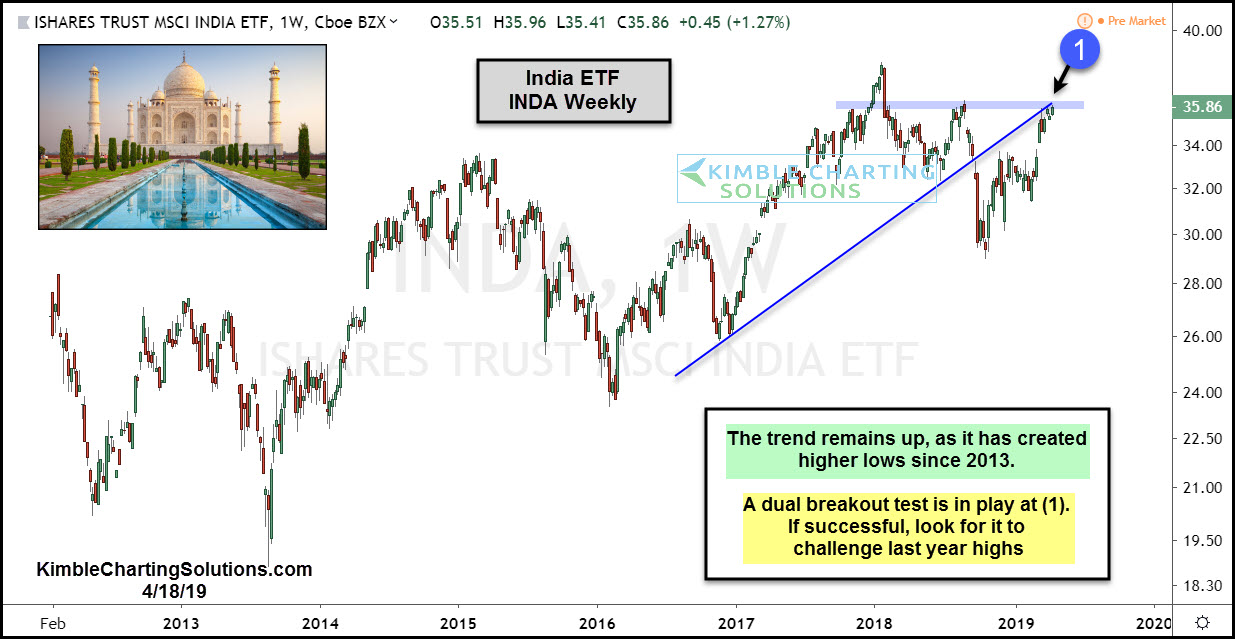
This chart looks at the India ETF (INDA) on a weekly basis over the past 6-years. Since the 2013 lows, INDA has created a series of higher lows. The rally off the 2018 lows has it testing the late 2017 highs and the highs of the past summer.
While testing prior resistance levels, it is also testing the underside of a rising resistance line.
INDA is testing dual breakout levels at (1). If it succeeds, look for it to attract buyers, where the next big upside test will be the 2018 highs.
What INDA does at (1), will send important messages to the region! Keep a close eye on what it does here over the next few weeks!
–
