
For most investors familiar with precious metals, it’s a great sign when silver out-performs gold.
It’s kind of like the old market analogy that it’s good when small-cap stocks or tech stocks lead the broader market higher.
Silver, like small caps and tech stocks, represents the high beta part of the financial markets. So, when silver leads, it means that precious metals have a more aggressive/bullish bid.
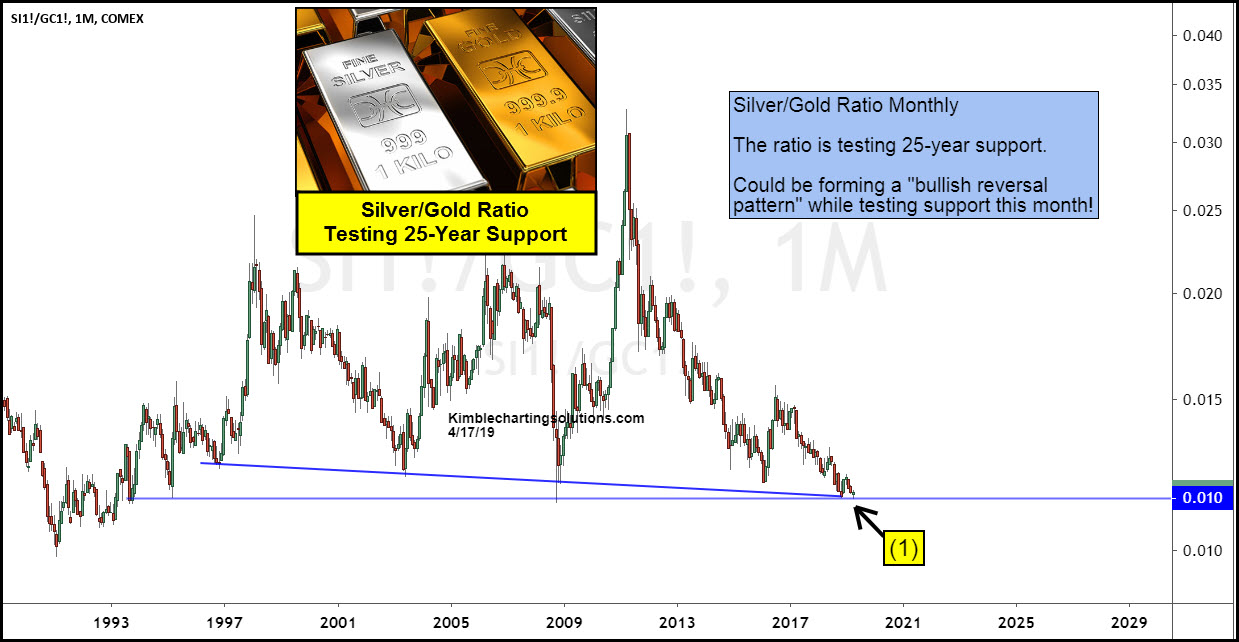
Take today’s chart for instance: A 25 years chart of the Silver to Gold ratio using monthly price bars.
First, you can see that precious metals have been out of favor since the 2011 top. But you can also see just how strong the ratio was leading into the 2011 top. That is what a bull market in precious metals looks like.
That isn’t the current look in 2019. HOWEVER, the Silver to Gold ratio is testing 25-year support this month. AND it looks like it could be creating a bullish reversal pattern.
Should the ratio turn higher it would be the first step in creating a more constructive environment for metal heads and gold bugs.
