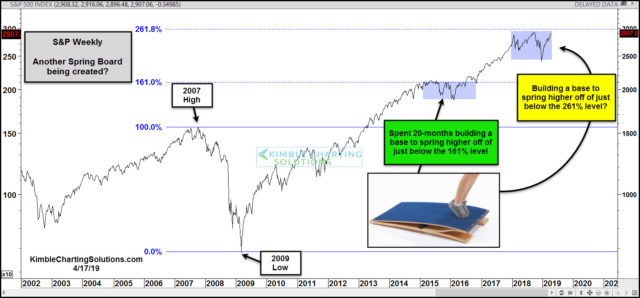
Is the S&P building a base to spring higher off of? Could be! This chart looks at the S&P 500, where Fibonacci was applied to the 2007 highs and 2009 lows.
The S&P traded sideways just below the 161% Fibonacci extension level for nearly 20-months. In hindsight, it was building a base to push higher from. Once it broke above the 161% level, it rallied nearly 50% in the year.
The S&P has traded nearly sideways below the 261% extension level over the past 15-months. Is the S&P building a base to spring higher off of? Possible.
Until broken, the 261% extension level comes into play as strong resistance. If it can take out the 261% level, the action over the past 15-months could be a base to push higher from.
Keep a close eye on the 261% resistance level, as this line in the sand could have a big impact on where the S&P is months from now!
–


