
How long as Tech been stronger than the S&P 500? 16-years! QQQ has outperformed than the S&P since the NDX 100 hit lows back in 2003.
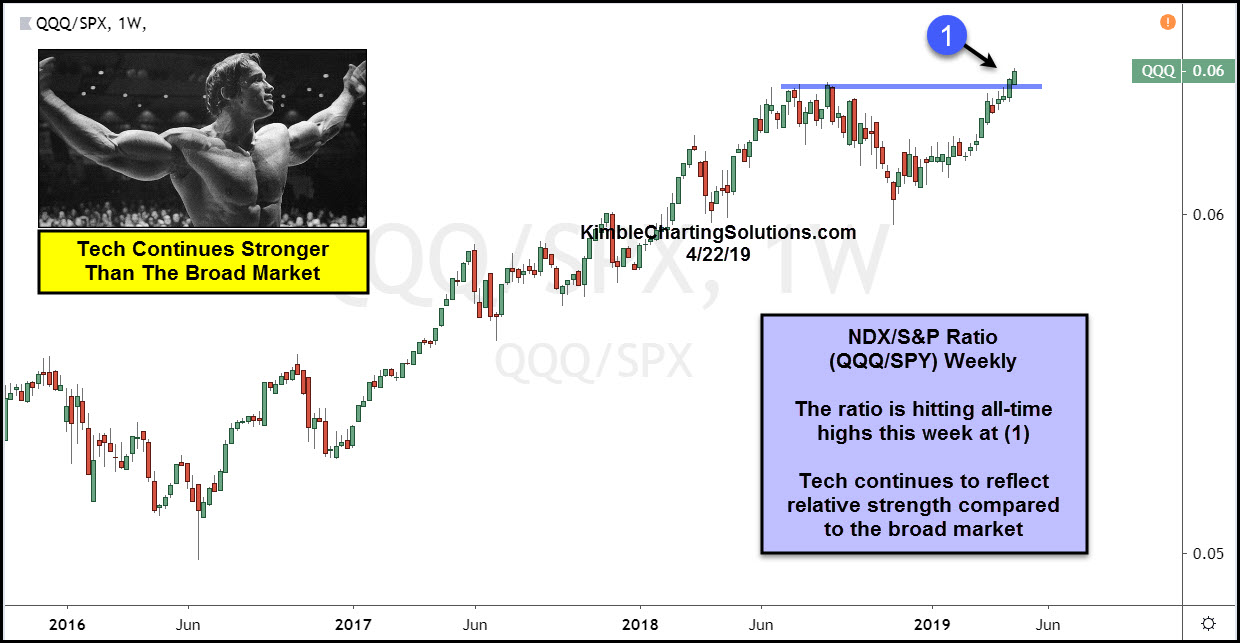
This chart looks at the QQQ/SPY ratio over the past 3-years. The ratio peaked 10-months ago and then declined into November of 2018. Since the lows of last fall, the ratio has been moving higher.
Last week the ratio broke above last years highs, which puts the ratio at all-time high levels.
This breakout reflects continued strength by Tech over the broad market, which historically sends a short-term positive message to the S&P 500. If this ratio continues to push higher, it increases the odds that the S&P will move above last years highs.
–
