
Is the S&P Kissing the underside of “Dual Resistance” for the first time in history? Looks like it!
Does that mean the market is topping here? Too soon to tell.
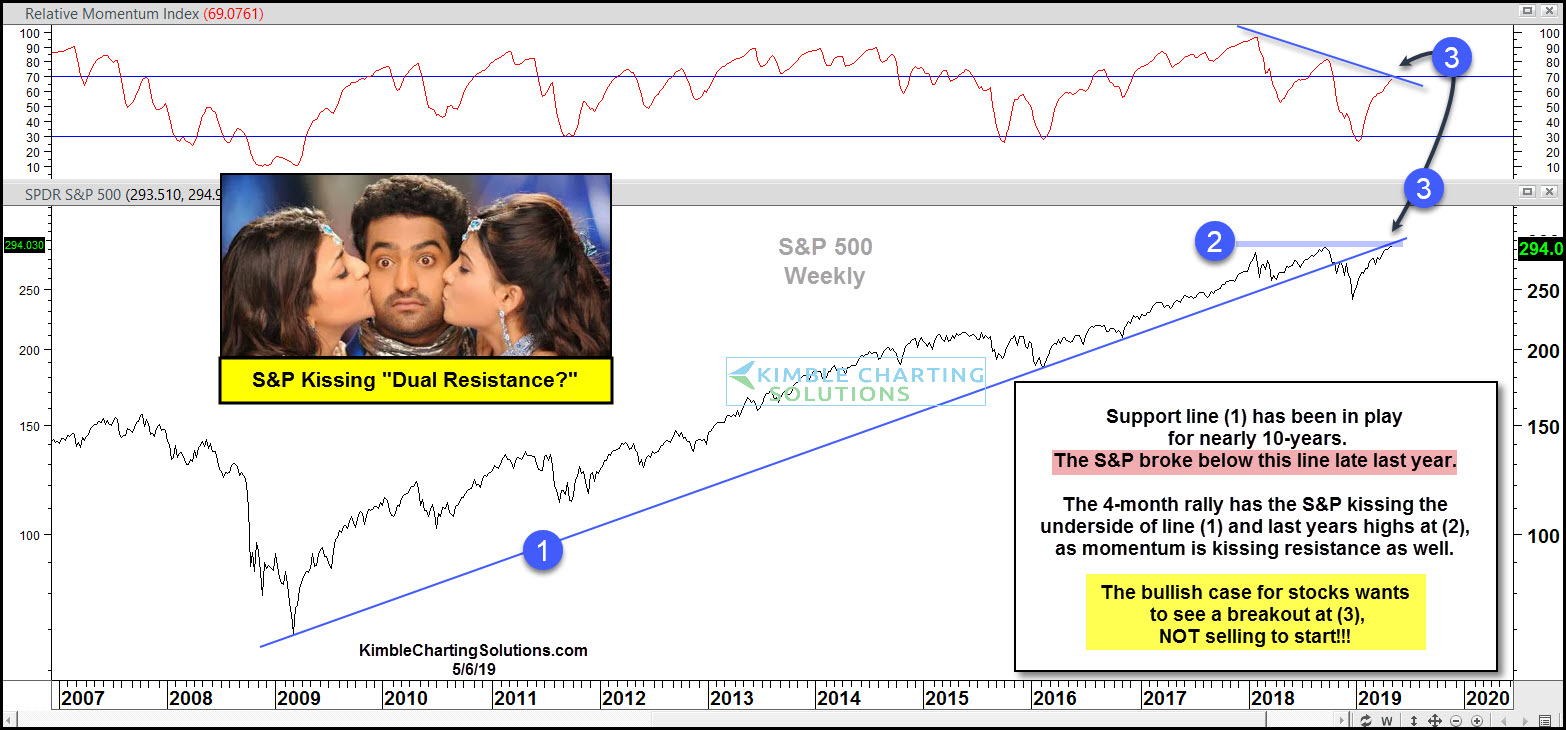
The S&P has remained above the rising support line (1) for nearly 9-years. It broke this support line last fall for the first time.
The rally off the lows around Christmas has the S&P “kissing the underside of line (1)” for the first time.
At the same time, it is kissing the underside of the line (1), it finds itself testing line (2), which is the highs of last year.
While kissing the underside of both lines, it is kissing the underside of falling momentum as well at (3).
Bullish for stocks = Breakout above potential resistance at (3)
Concerning for stocks = Selling pressure gets underway as it kissing these potential resistance points at (3).
–
