
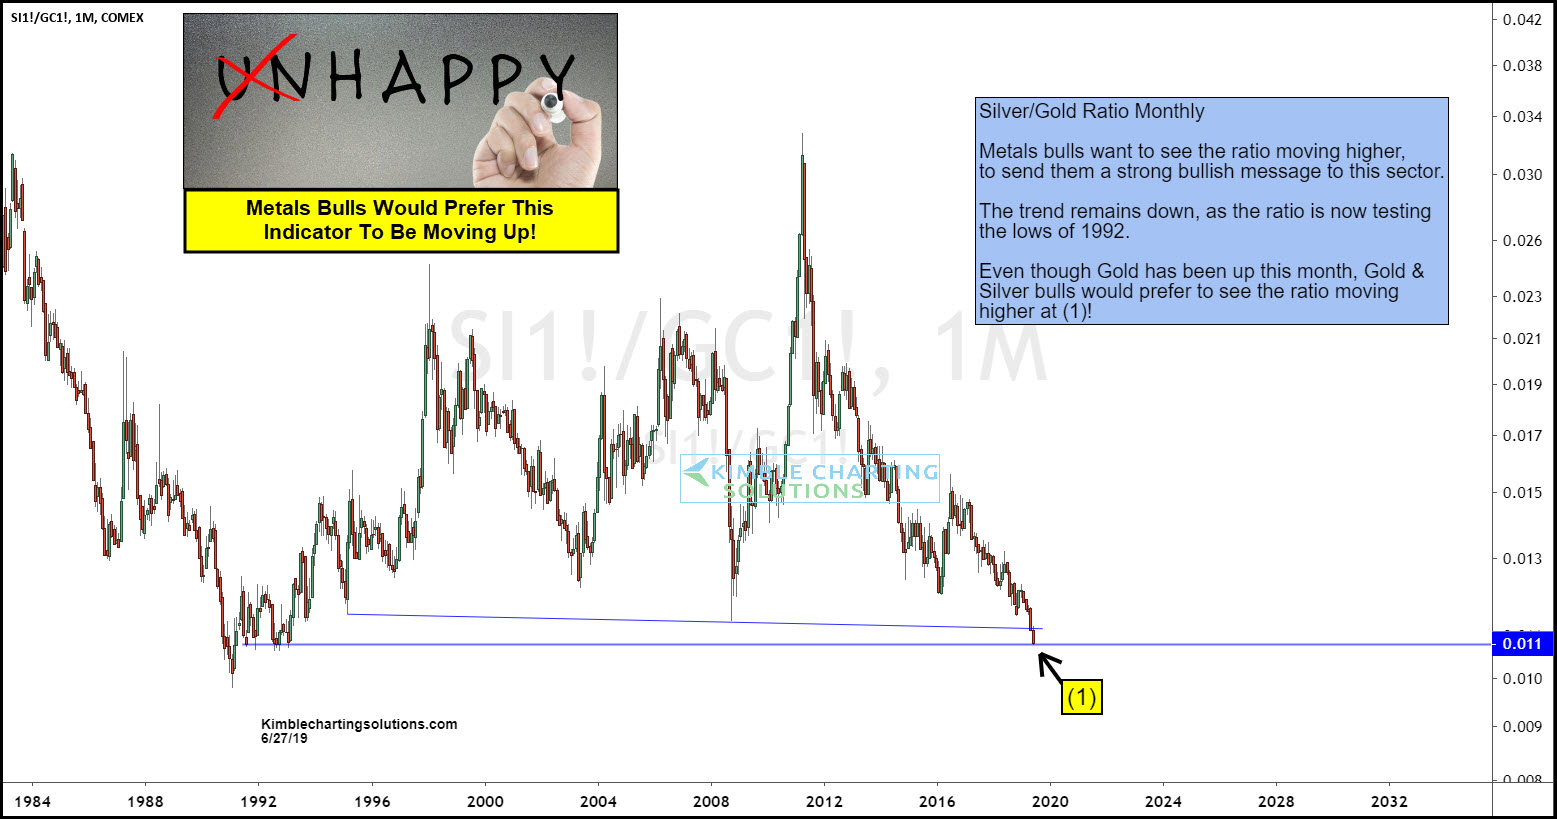
This chart looks at the Silver/Gold ratio over the past 25-years. Historically bullish investors in Gold & Silver receive a positive message when this ratio is heading higher. When the ratio is heading lower, historically rallies in Gold often times have been short-lived.
The trend since the 2011 highs has been down, as the ratio has created a series of lower highs and lower lows. The decline over the past 8-years has the ratio at the lowest level in the past 28-years, as it is testing the 1992 lows at (1).
Even though Gold has moved up this month, the ratio has continued to move lower, reflecting Silvers weakness to Gold.
This weakness is of some concern to bullish metals investors as the month is nearing a close.
Bullish metals investors would receive “Happy News” from this ratio if it rallies off the 1992 lows!
–
