
The stock market has been on fire of late, rallying up to the edge of price resistance on several indexes. Today, we look at one of those stock market indexes: the Wilshire 5000.
The Wilshire 5000 tracks all of the stocks in the US market, so it is a broad-based index that carries significant importance when gauging the health of the overall US stock market.
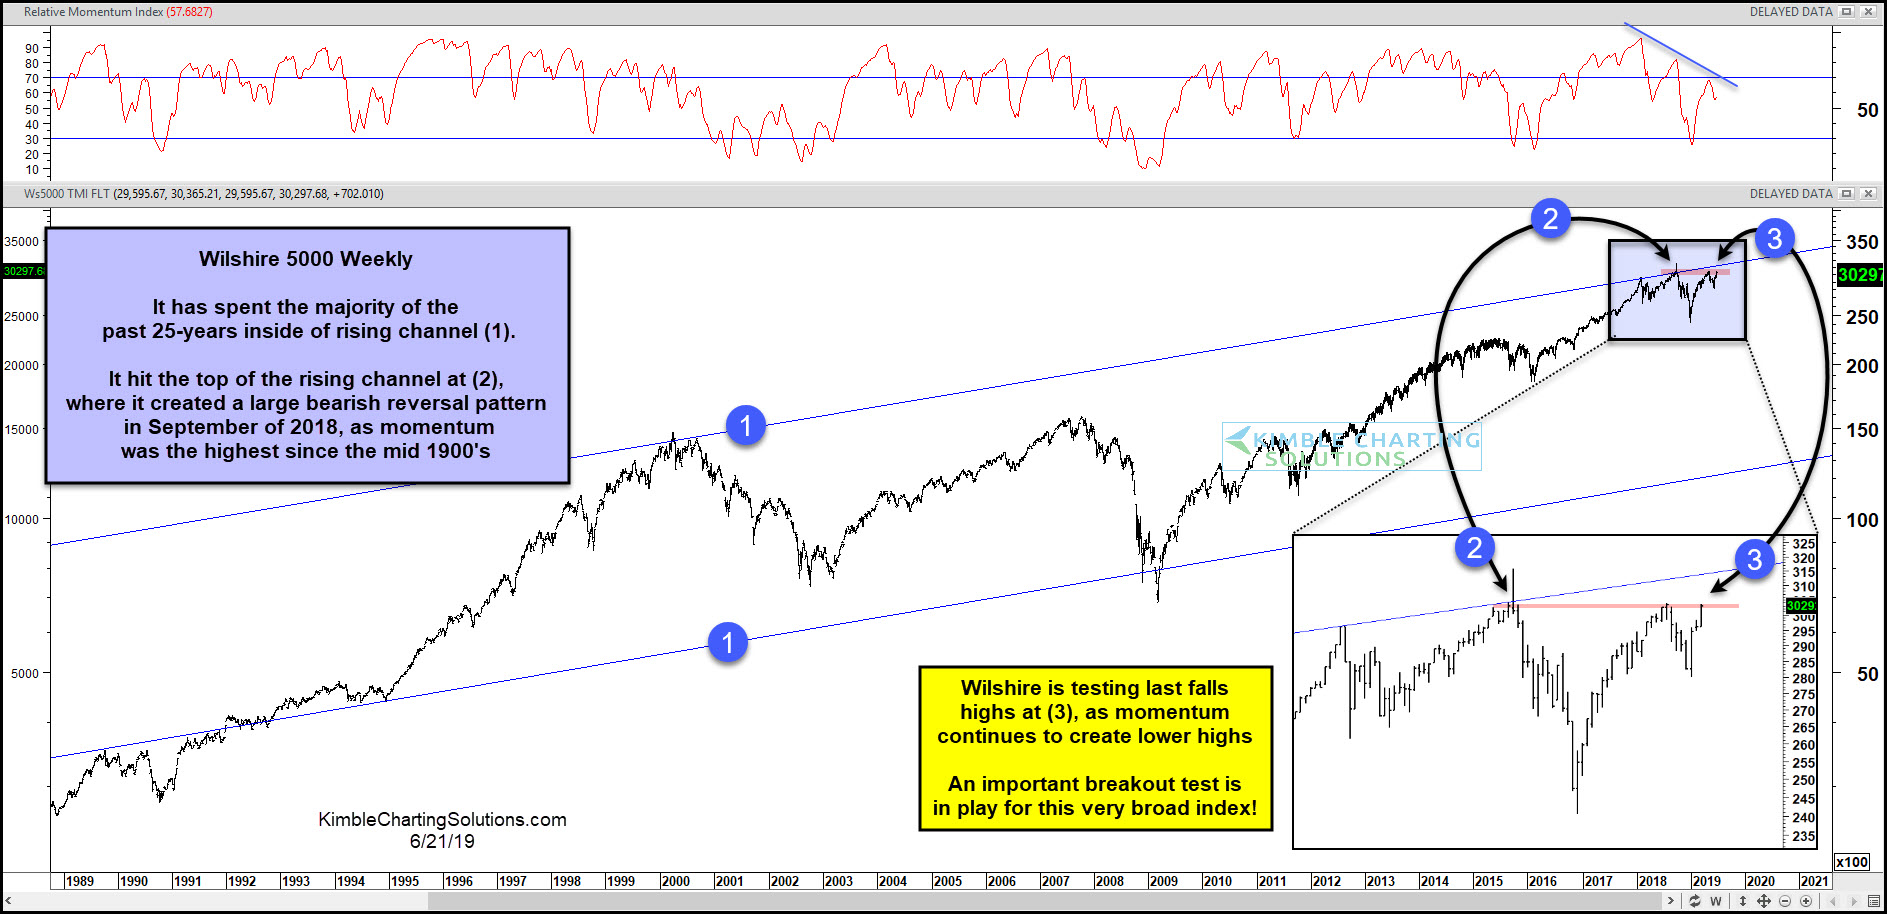
Looking at the long-term “weekly” chart above, it is pretty clear that the index is at an important price juncture.
The Wilshire 5000 spent the last 25 years trading within a rising price channel (1). It tested the top of that price channel at (2), creating a large bearish reversal candle in September of 208, that lead to a steep decline in year-end. It then retested that level in April, where it failed to breakout again.
This broad-based stock index is currently testing last fall’s highs at point (3). This comes at the same time that momentum is testing its downtrend line.
The bullish case for stocks DOES NOT want this broad index to be creating a triple top.
Stock bulls would receive wonderful price news if this broad index succeeds in breaking out at (3).
An important inflection point is in play for one of the broadest of all stock indices in the states at this time!!!
This article was first written for See It Markets.com. To see the original post, CLICK HERE.
–
