
The big news of the day seems to be the inversion of the yield curve. An inversion oftentimes suggests that the economy will be slowing in the future and recession odds increase.
Another important economic message looks to be coming from the Thomson Reuter Equal Weighted Commodity Index!
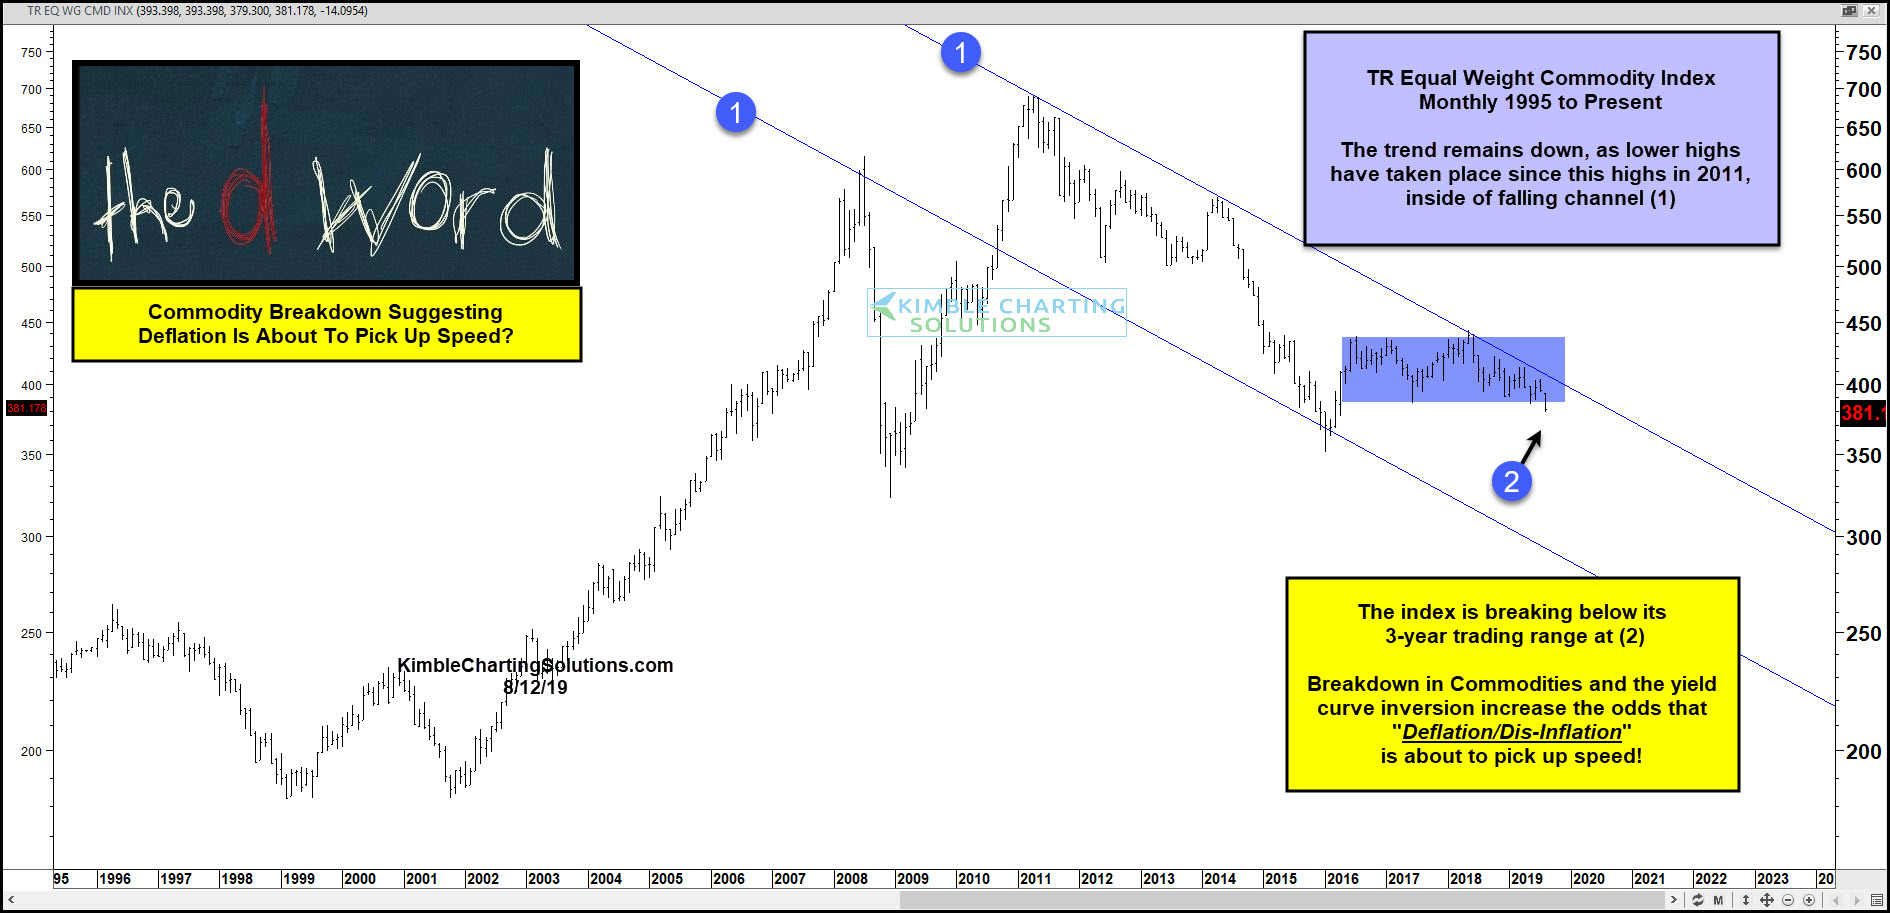
This chart looks at this important Commodities index over the past 20-years. Since the highs in 2011, commodities have remained inside of falling channel (1).
The index has traded mostly sideways over the past 3-years inside of the blue shaded rectangle.
This month, commodities are attempting to break below the 3-year trading range at (2).
A decline in Commodities, TIP/TLT and Copper Gold ratios and the inversion of the yield curve, increase the odds that Dis-inflation/Deflation is about to present challenges in the global market place.
