
Are metals bulls about to receive a long-awaited positive message? It won’t take long to find out based upon this chart!
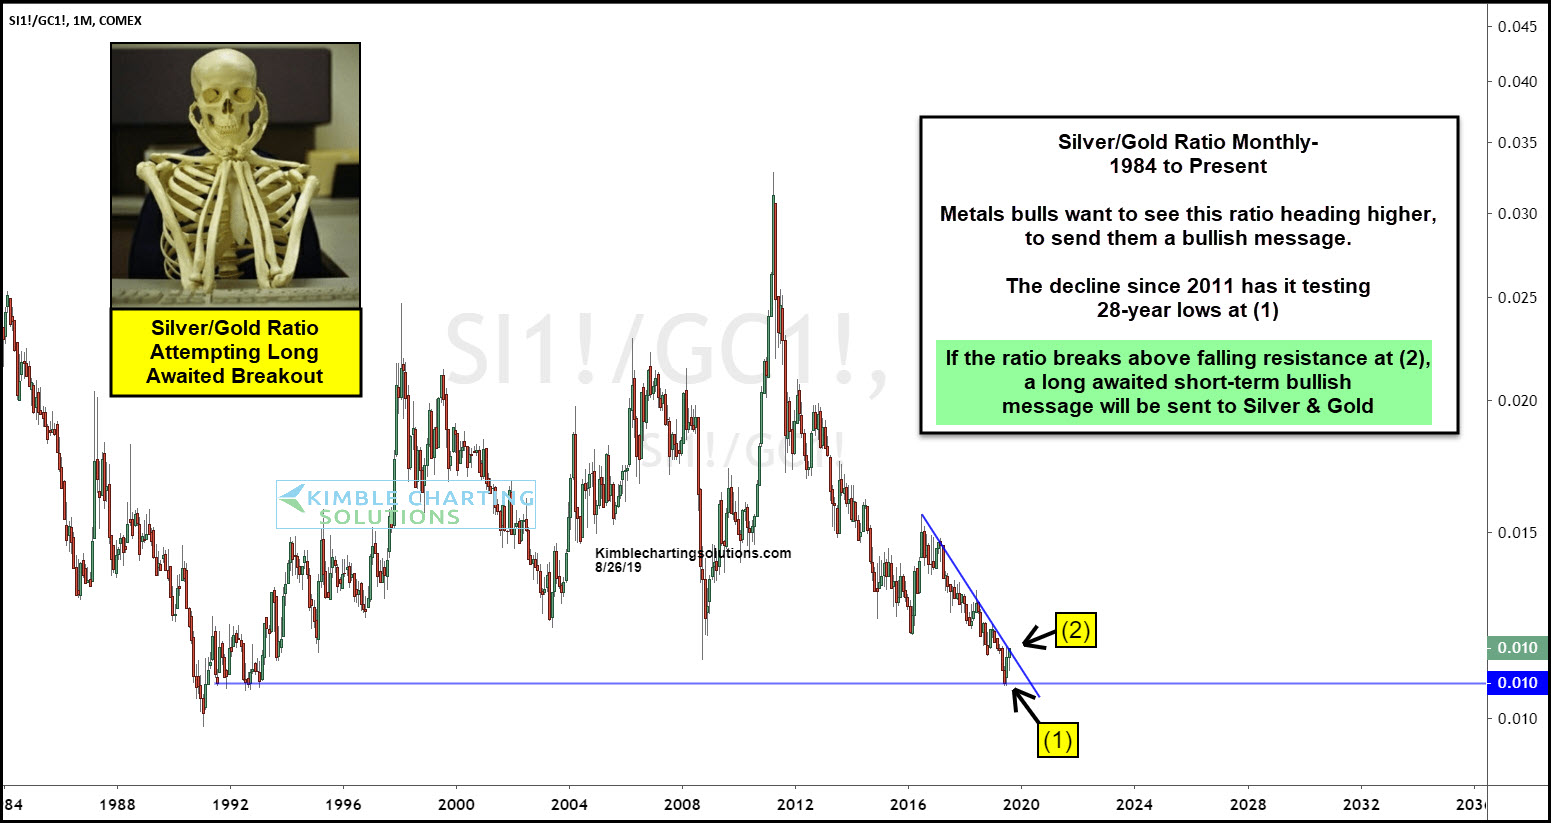
This chart looks at the Silver/Gold ratio on a monthly basis since the early 1980s. Metals bulls historically want to see this ratio moving higher, to send Gold & Silver a positive message.
The ratio has been in a funk since it peaked in 2011. The eight-year decline has driven the ratio down to the lowest level in 28-years.
A bullish reversal pattern took place two months ago while testing this 28-year support level at (1). The rally of late has it testing 3-year falling resistance at (2).
If the ratio breaks out at (2), a long-awaited short-term bullish message will be sent to Silver and Gold bulls!
