
Does history ever repeat itself exactly? Not so much. Do stock market patterns sometimes and momentum sometimes look the same? Yes, says Joe Friday.
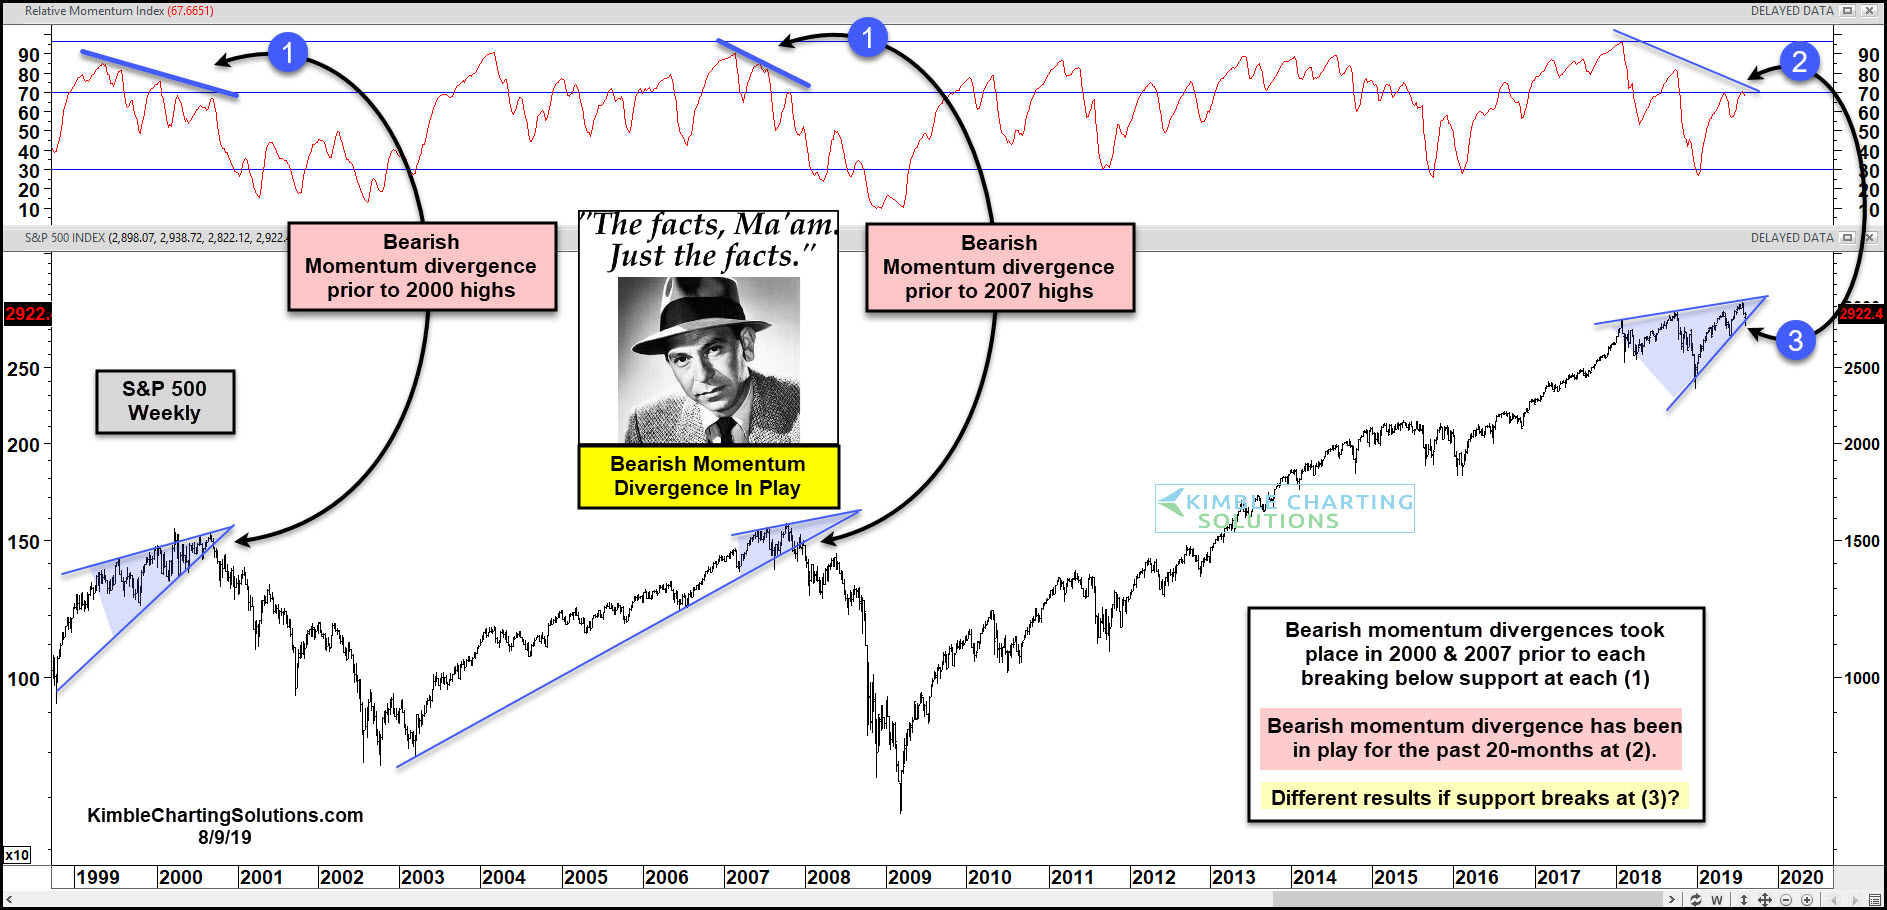
This chart looks at the S&P 500 over the past 20-years, on a weekly basis, with momentum in the top section.
In 2000 & 2007, weekly momentum started experiencing lower highs, while the market was creating higher highs at each (1). Momentum was experiencing a bearish/negative divergence with the S&P 500 both times. Once support broke 2000 & 2007, selling pressure took over.
Over the past 20-months, momentum has created lower highs at (2), while the S&P has created higher highs.
Joe Friday Just The Facts Ma’am; The S&P could experience selling pressure if support happens to break at (3).
–
