
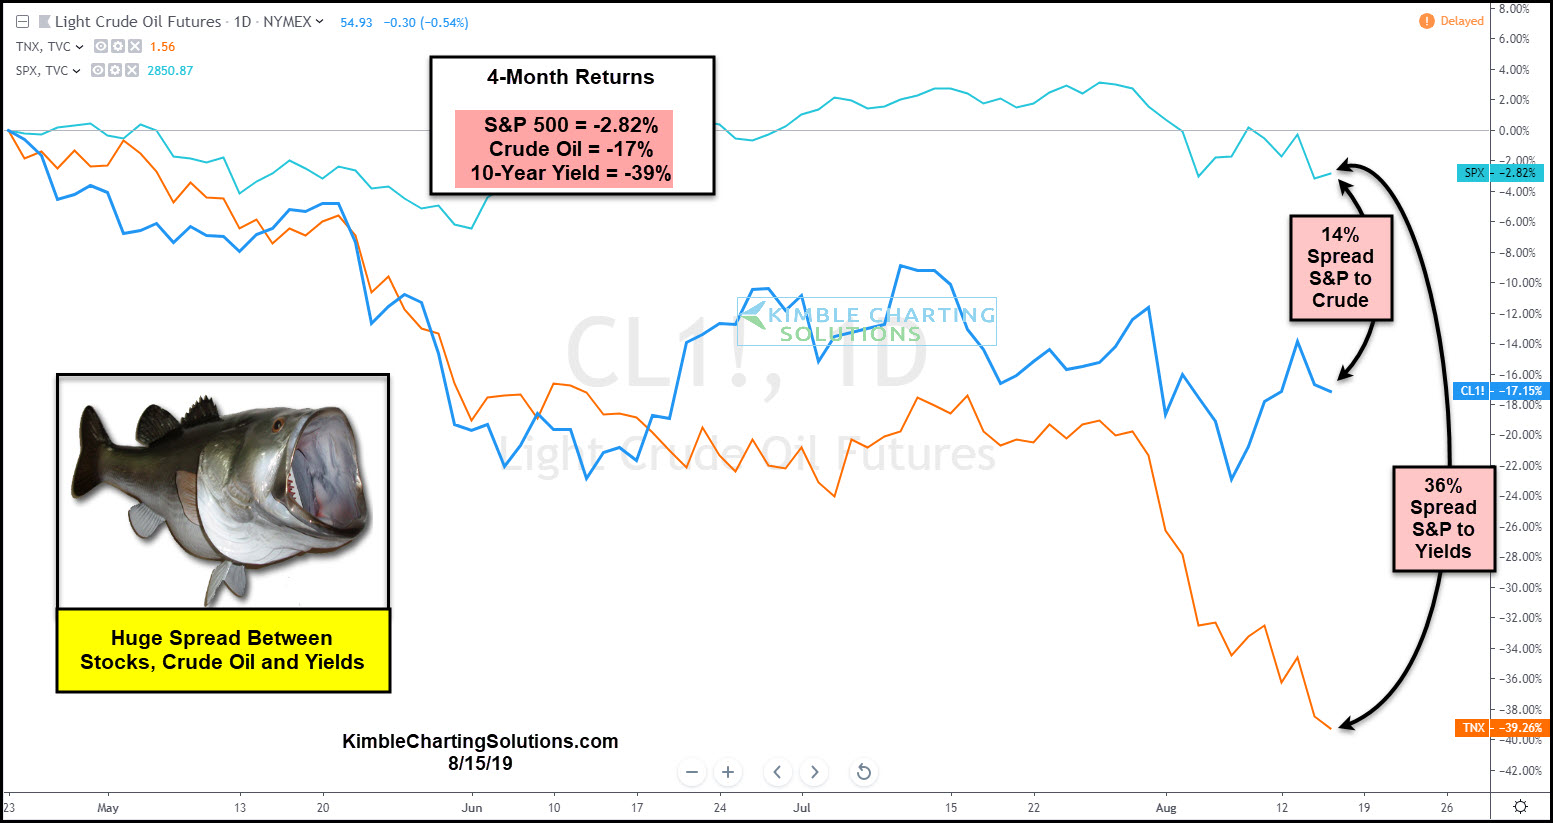
This chart looks at the performance of the S&P 500, Crude Oil and the Yield on the 10-Year note over the past 4-months.
Crude Oil has declined around 14% more than the S&P during this time frame. Yields have declined, even more, around 36%. The is a huge spread between these assets over this short of a time period.
A few important questions; Will the S&P 500 fall another 14% to catch up with the Crude Oil decline? Will the S&P fall another 36% to catch up with the decline in yields? Has Crude and Yields dropped too far?
Odds are very high that these “Fish Mouth” spreads will narrow, as spreads of this size historically narrow over time.
Is it possible that the spreads narrow by a decline in stocks and a rally by the other two? Anything is possible these days!
–
