
If one invested in the India ETF (INDA) back in January of 2012, your total 7-year return would be 24%. During the same time frame, the S&P 500 made 124%. The 7-year spread between the two is a large 100%!
Are things about to improve for the INDA ETF and could it be time for the relative weakness to change? Possible!
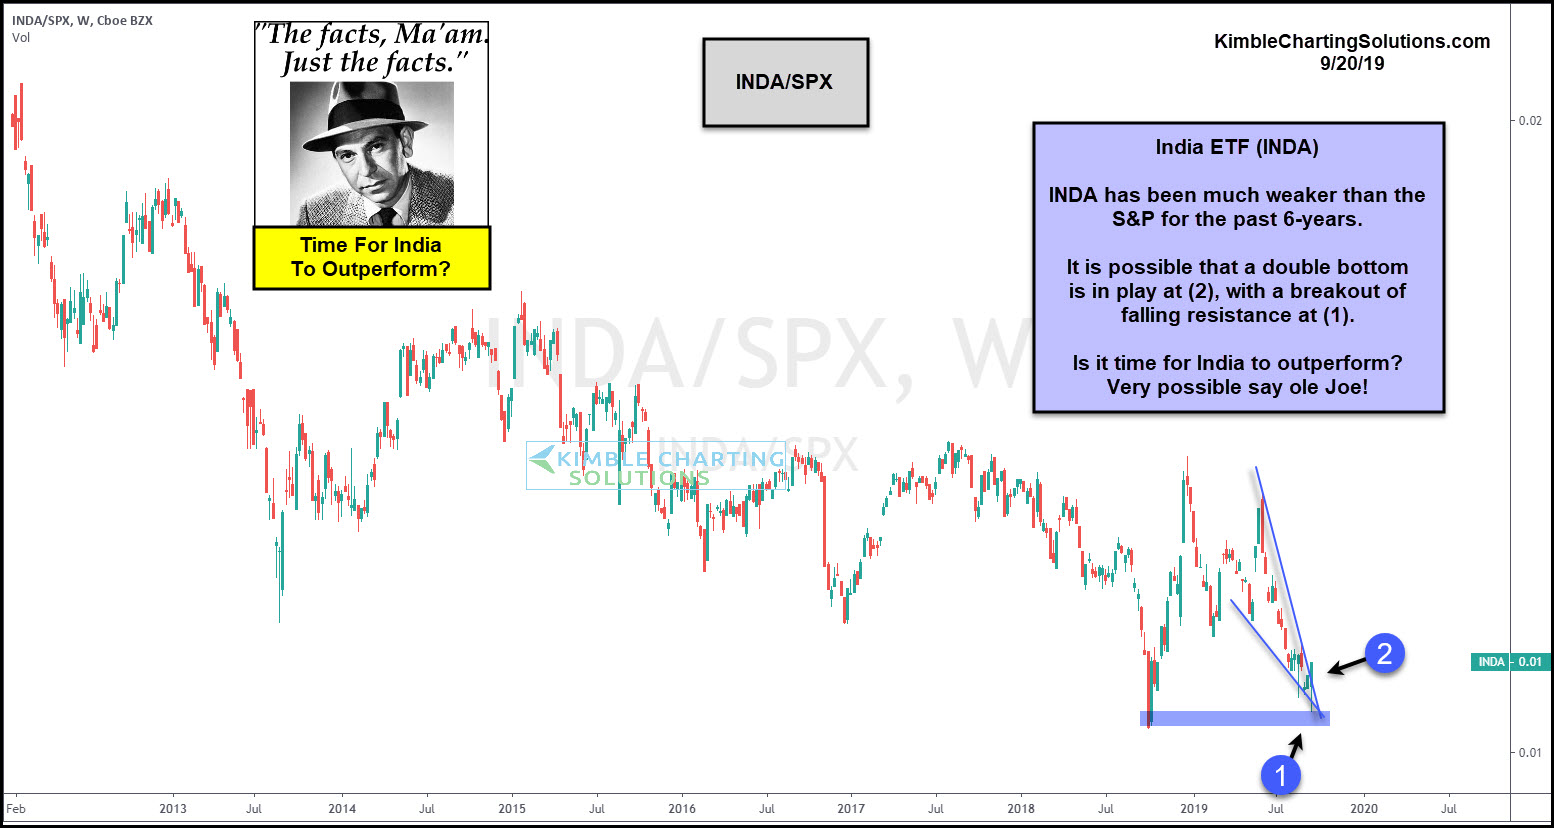
This chart looks at the INDA/SPX ratio since early 2012. The ratio continues to be in a major downtrend.
The ratio hit a 7-year low a few months ago and this week it kissed those lows again at (1). The ratio near weeks end is attempting to create a bullish reversal pattern and a breakout at (2).
Joe Friday Just The Facts Ma’am; The INDA/SPX ratio is attempting a breakout. It is possible that INDA is about to reflect some relative strength against the S&P 500!
