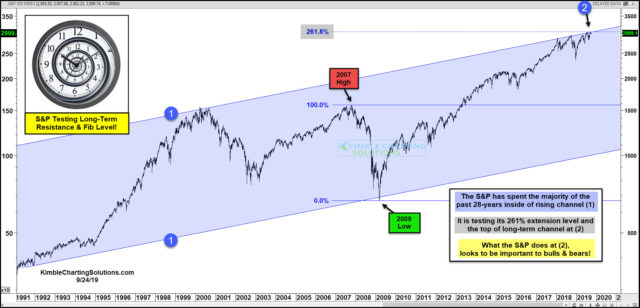
Is the S&P facing a 28-year breakout/resistance test as well as an important Fibonacci extension level at the same time? Looks like it!
The chart looks at the S&P 500 since the early 1990’s. It has spent the majority of the past 28-years inside of rising channel (1).
We applied Fibonacci extension levels to the 2007 highs and 2009 lows.
The S&P is now testing the top of this 28-year rising channel and its 261% extension level at the same time at (2).
Bulls would love = Breakout of the channel and the Fibonacci extension level at the same time
Bears would love = S&P to peak as it kisses the underside of the channel and the Fibonacci extension level!
This looks to be a very important price point for the bulls and bears!


