
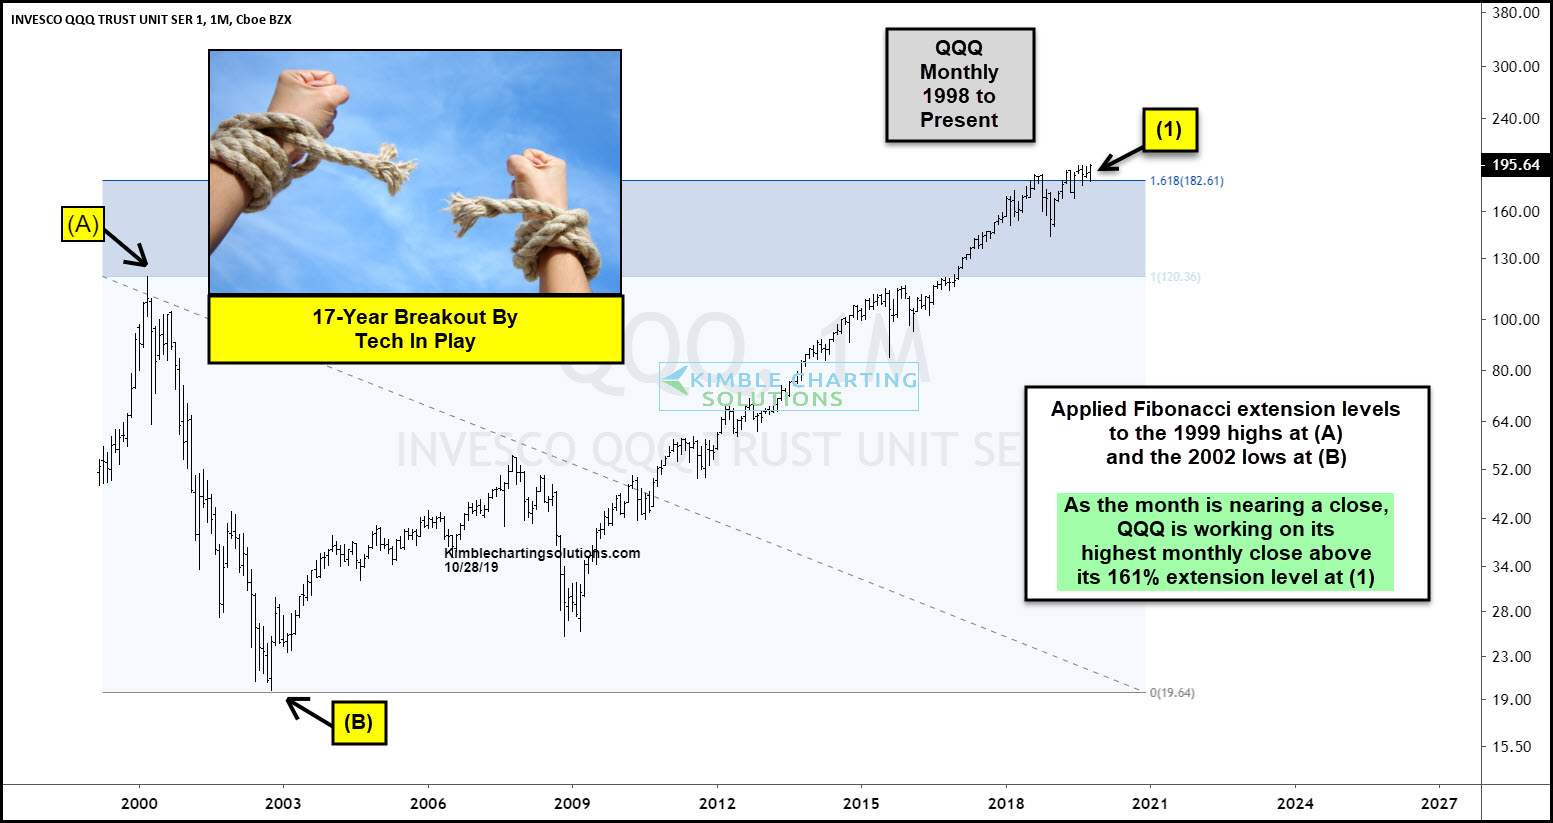
This chart looks at Tech ETF (QQQ) on a monthly basis over the past 20-years, where Fibonacci extension levels were applied to the 1999 highs at (A) and the 2002 lows at (B).
Last September QQQ met a ton of selling pressure on its first attempt to break above the 161% level. This selling pressure drove QQQ down nearly 20% into the last week of December.
The rally over the past 10-months has QQQ working on a solid breakout above the 161% level at (1).
Should QQQ succeed in closing the month at the highest monthly closing price in history, it sends a positive message from this sector to the broad markets.
