
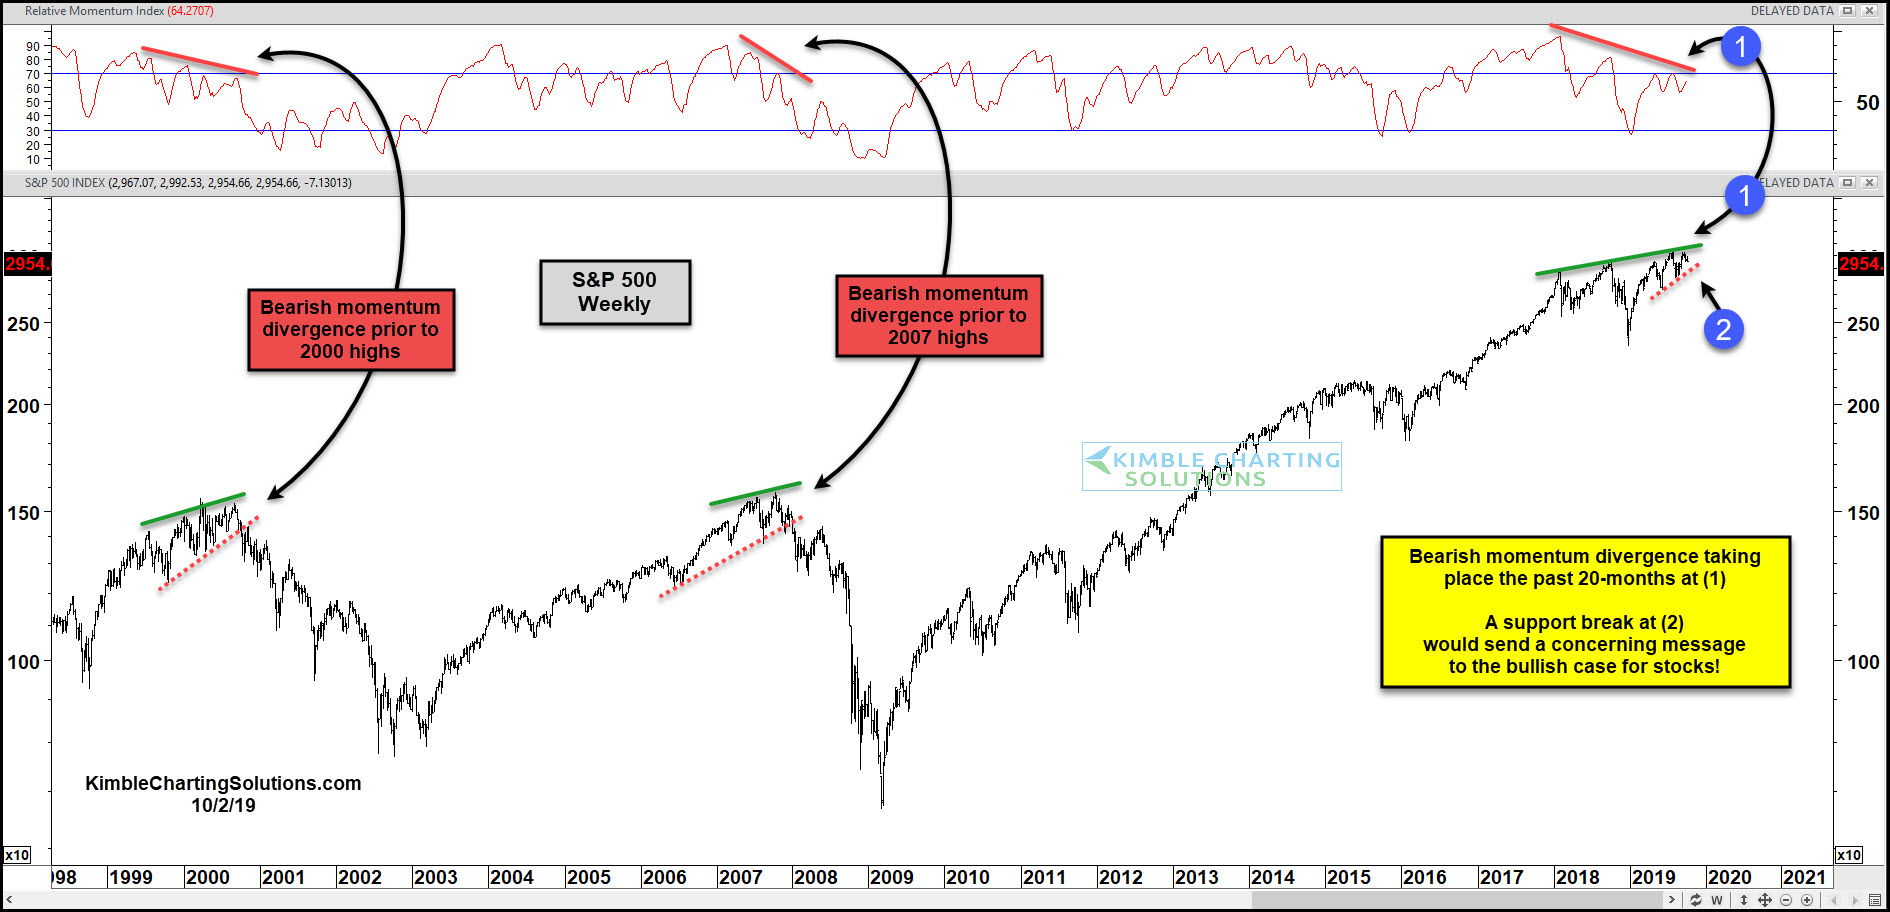
Stock market deja vu?
One key stock market indicator is sending a cautionary message to investors right now… one that we saw back in 2000 and 2007.
In today’s chart, we take a long-term look at the S&P 500 Index versus its relative momentum.
As you can see, momentum has been slowing for the past couple of years producing lower highs. At the same time, the S&P 500 is making new highs – see each point (1).
This is a classic bearish market divergence.
Momentum divergences are difficult to time but important to be aware of.
Why? One reason is that similar momentum divergences produced the 2000 and 2007 highs and bear markets that followed.
From a technical perspective, stock bulls will go from “aware” to concerned if price support breaks at (2). Stay tuned!
This article was first written for See It Market. To see the original post CLICK HERE.
