
Boeing (BA) seems to be in the news a ton of late. But perhaps an even more important bit of news for investors has to do with the long-term chart of Boeing’s stock (BA).
And how this chart pattern plays out will have ramifications for $BA investors, as well as the broader market (as Boeing is a large-cap in the Dow Jones Industrials Average).
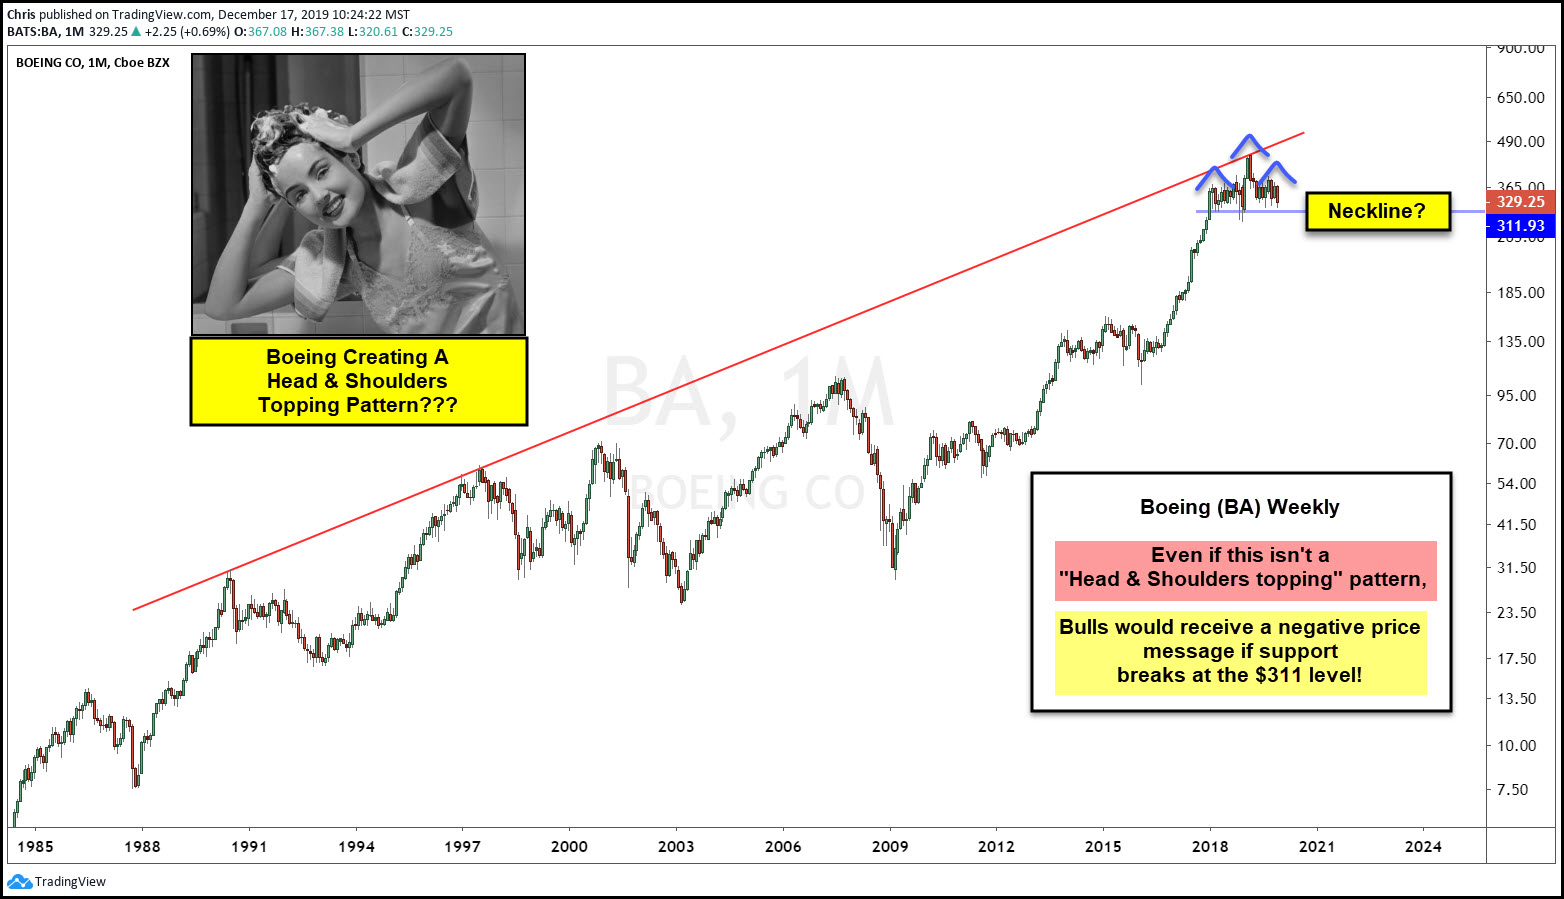
Is $BA Creating A “Head and Shoulders” Topping Pattern?
As you can see in the chart above, a potential “head and shoulders” topping pattern is in play on the “weekly” chart for Boeing (BA). And even if this is considered to be a sloppy head and shoulders pattern, the formation has the look of a potential rounded top as well. This will go from a minor concern to major concern should Boeing break down through neckline support.
With this in mind, investors should watch the $311 price support, as support is support until broken. Bulls do not want to lose that level. Stay tuned!
This article was first written for See It Markets.com. To see original post CLICK HERE
