
It’s a good idea for investors to be aware of key indicators and inter-market relationships.
Perhaps it’s watching the US Dollar as an indicator for precious metals or emerging markets. Or watching interest rates for the economy. Experience, history, and relationships matter. And it’s good to simply add these to our tool-kit.
Today, we look at another relationship that has signaled numerous stock market tops and bottoms over the years, and especially the past several months, Crude Oil.
When crude oil tops or bottoms, it seems that the stock market follows along. And with Crude oil reversing lower last week, it’s probably a good idea that investors pay attention here.
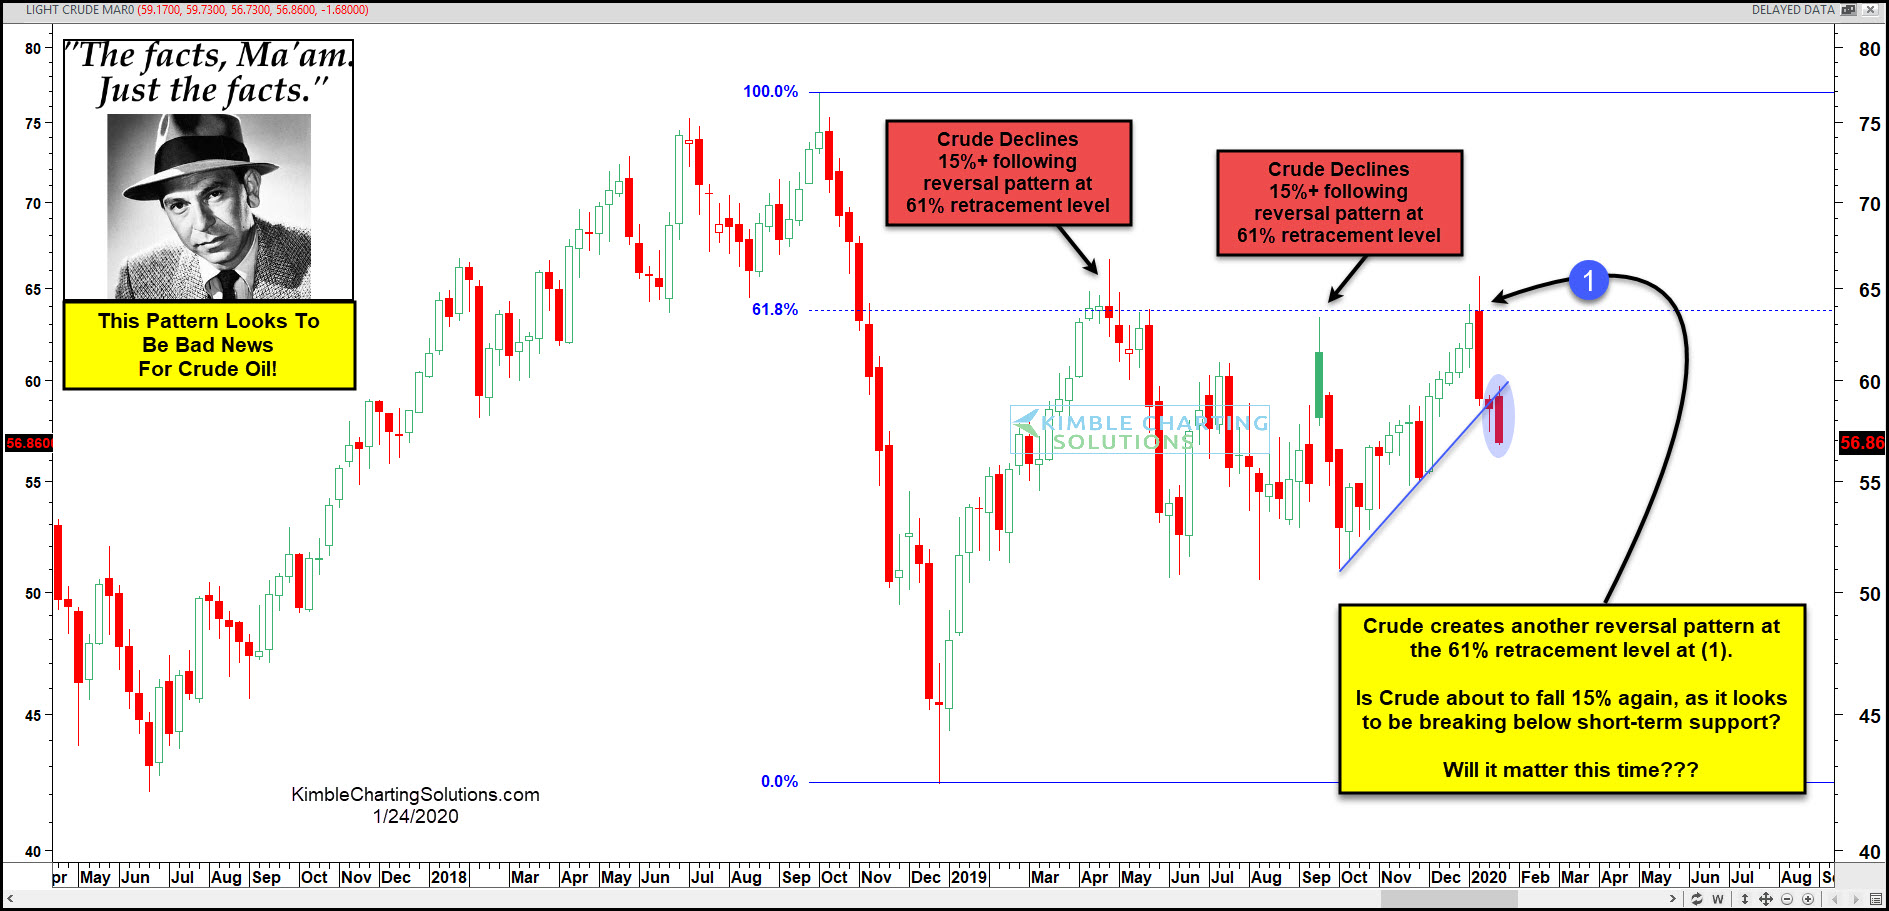
Joe Friday Just The Facts Ma’am: The past two times Crude Oil has created a reversal pattern at the Fibonacci 61% retracement level, it fell at least 15% from the highs. Odds are strong that due to this pattern, Crude will experience a similar decline again.
This article was first written for See It Markets.com. To see the original post CLICK HERE.
