
Is a bearish reversal pattern in S&P 500 taking place at a key Fibonacci level? Possible!
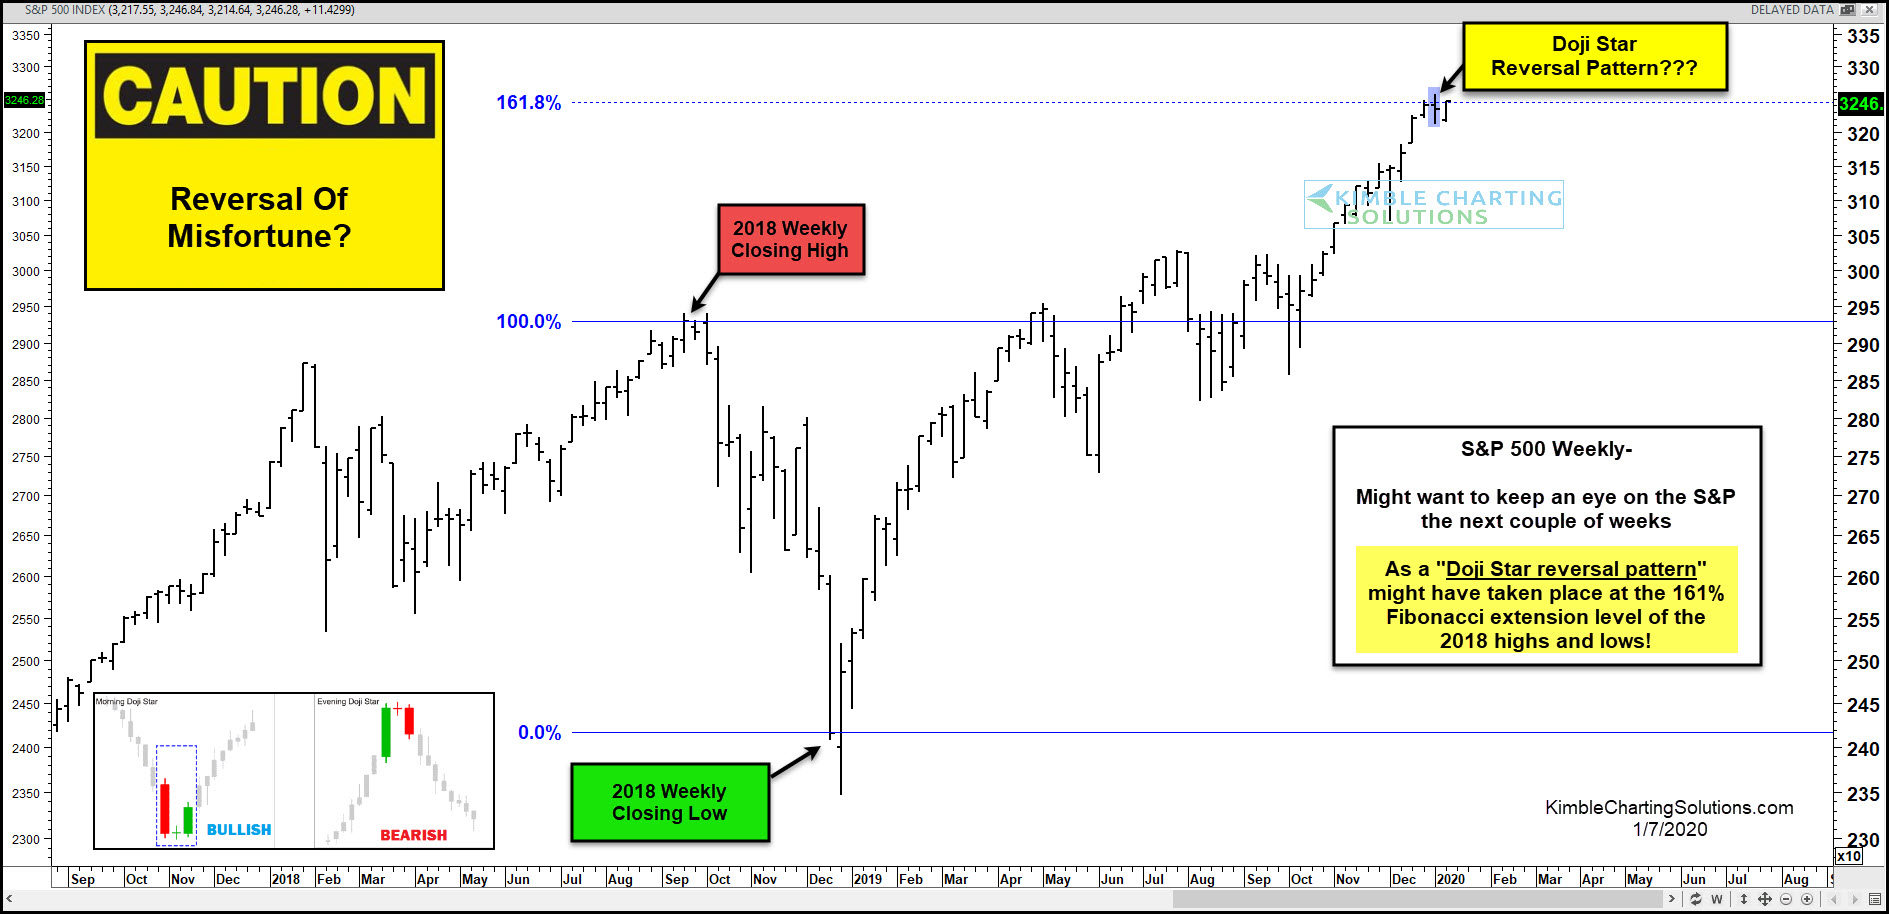
This chart looks at the S&P 500 on a weekly basis over the past few years, where Fibonacci was applied to the “weekly closing highs and lows” during 2018.
The rally off the lows around Christmas of 2018, has the S&P testing its 161% extension level of the 2018 highs/lows.
As it hit the 161% level last week, it might have created a “Doji Star” topping pattern.
Odds are high it will take a few weeks to prove if a topping pattern took place at this important extension level.
If this truly is a reversal pattern, it could become a reversal of misfortune for the bullish case.
Stay tuned friends, this is a very interesting price point the S&P faces to start out the new year!
