The trend for Apple (AAPL) is definitely higher. Is Apple facing a key price test to determine if the trend remains the same? Yes!
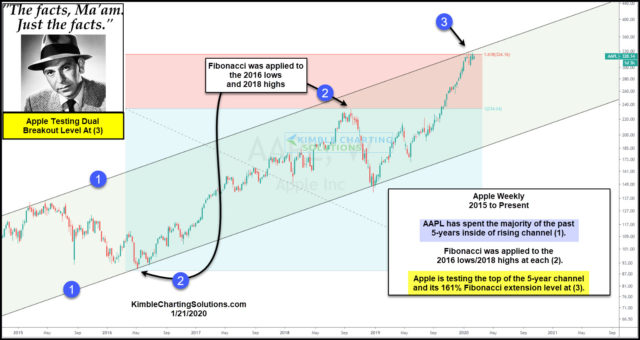
The chart looks at AAPL on a weekly basis over the past 5-years. Apple has created a series of higher lows and higher highs, which has created a rising channel (1).
Fibonacci was applied to its 2016 lows and 2018 highs at each (2).
Apple is currently testing the underside of the rising channel (1) and its 161% Fibonacci extension level at (3).
Joe Friday Just The Facts Ma’am; A key breakout test is in play for Apple at (3). Bulls would love a successful breakout at this key price juncture.
On the flip side, Apple bulls would receive a discouraging price message if selling takes place at this key breakout price point. Joe suggests Apple will send an important message by what it does at (3).


