Crude Oil created its second top back in October of 2018 at (1) and then it proceeded to decline nearly 50%!
What did the S&P do while Crude declined 50%, it fell nearly 20% in less than 90-days!
The above chart was shared on 1//8/2000, suggesting that Crude Oil looked to be creating a “Double Top” at (3) and stocks should get hit hard again!
Below is an update of the Crude Oil Chart from above-
Are the concerns over the Virus important? You bet!!!
Is the current weakness in the markets solely based upon the virus news? I don’t think so!
Crude Oil has been creating lower highs for the past 18-months, creating a bearish/negative divergence with stocks.
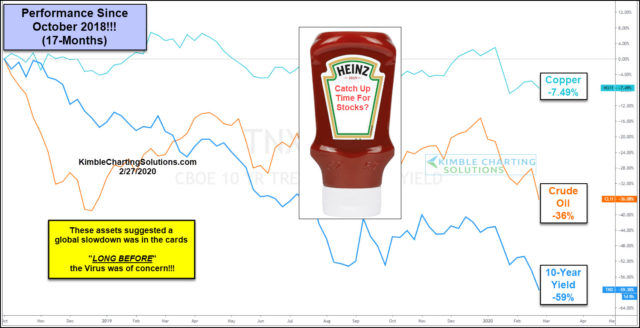
Is Crude Oil the only economically sensitive asset that has been suggesting the global economy is going to slow down?
In my humble opinion, these economically sensitive assets have been sending an important macro message to stocks for nearly 18-months, that the majority of investors have chosen to ignore!


