
One of the broadest indices in the states remains in a long-term bullish trend, where a critical support test is in play.
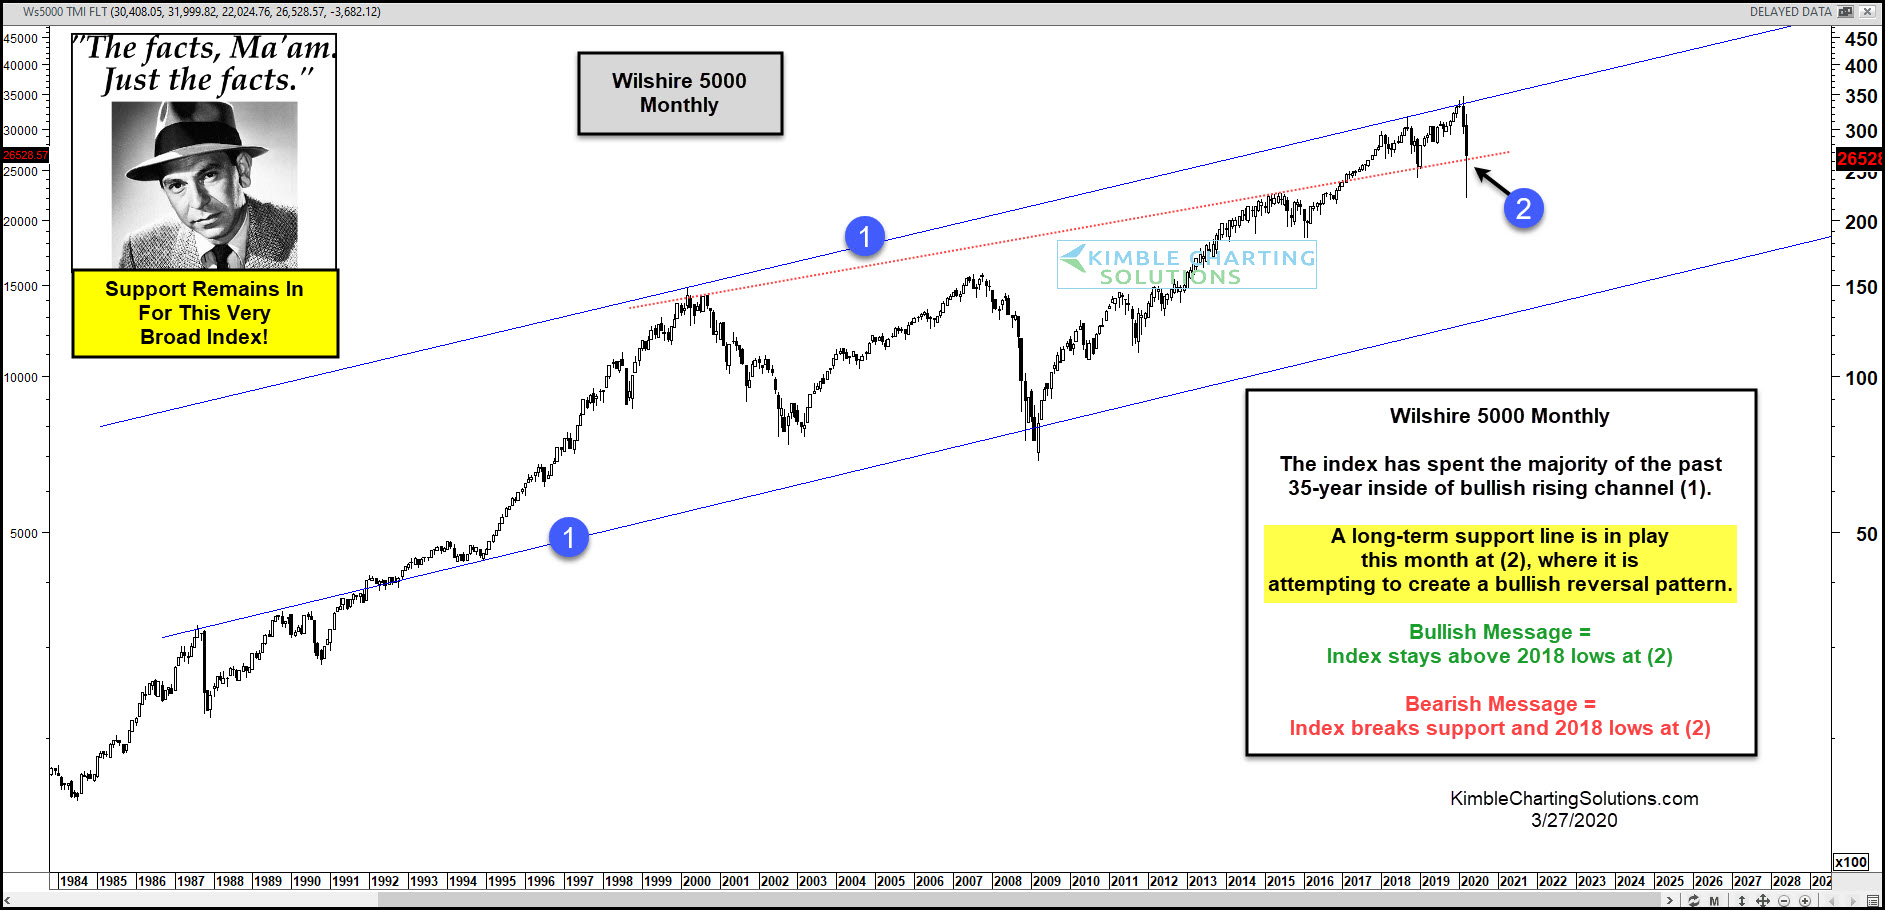
The chart looks at the Wilshire 5000 on a monthly basis over the past 35-years.
The index has spent the majority of the past three decades inside of rising channel (1). It hit the top of this multi-decade channel to start off the year, where it created a monthly bearish reversal pattern.
Weakness the past 2-months has the index testing rising support and the December 2018 lows at (2).
Joe Friday Just The Facts Ma’am;
Bullish message = support holds at (2).
Bearish message = The index breaks 2018 lows at (2).
