
Crude Oil Topping Pattern and Market Crash Charts
The importance of crude oil to the world economy cannot be overstated. Even with the rise of alternative fuel resources, oil remains king.
This is why I monitor crude oil prices as a potential indicator for the economy and the stock market. And recently, the oil and stocks have gone hand in hand.
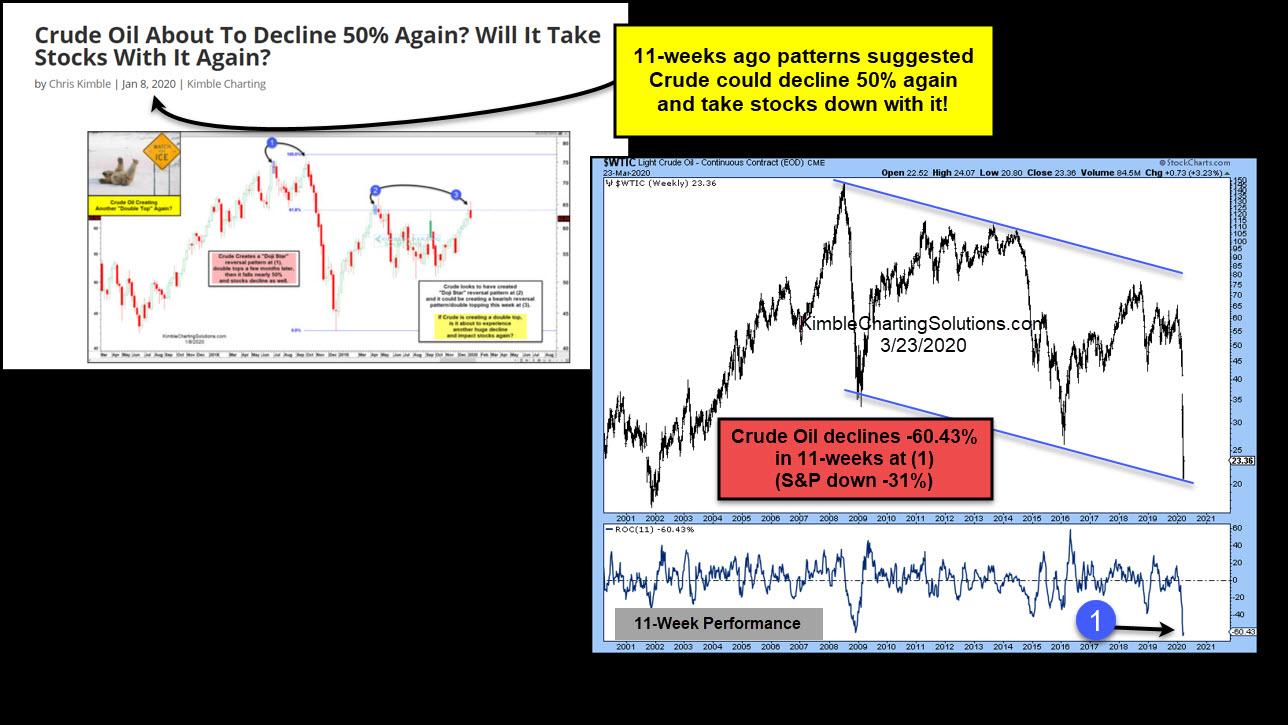
On January 8th, patterns suggested crude could fall 50% again and stocks could go down with it. The upper left chart in today’s 2-pack is from that post.
The lower right chart looks at the performance of crude oil since the post, reflecting its largest 11-week decline in the past 20-years, down 60% while the S&P 500 Index is down 31%.
The decline in crude oil has it testing the bottom of its falling channel at extremely oversold levels. This could lead to a bounce in oil prices. And perhaps that will help stocks bounce as well. Stay tuned!
This article was first published on See It Markets.com. To see the original post CLICK HERE.
