
Bearish reversal patterns are always a sign of caution.
But when they happen on broader time frames, like “weekly” and “monthly” candles, they can be of a more serious nature.
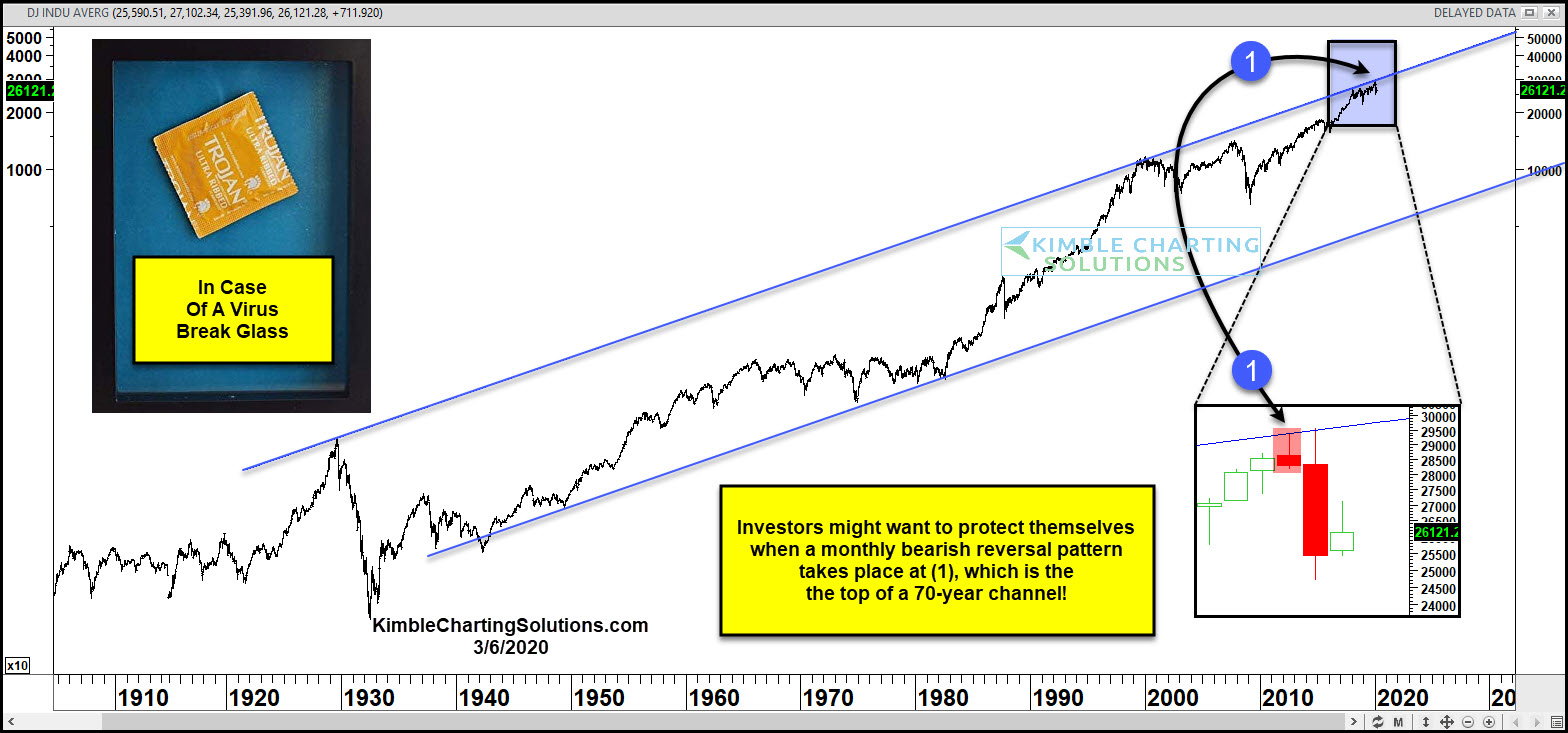
In this case, the Dow Jones Industrial Average put in a bearish “monthly” reversal pattern at (1). Note that this coincided with a test of the top of a 70-year rising channel!
This lead to more selling in February (another reversal) and March… and a stock market correction, or perhaps even a bear market. I highlighted this potential “double whammy” for stocks in February.
I post bearish and bullish reversal patterns to help investors identify possible changes in trend (whether it be for trading or investing purposes). Knowing when to beginning taking profits (or making profits) is an important part of investing.
The first bearish monthly reversal pattern took place 40-days ago! This pattern gave investors ample warning of what was to come!!!
This artice was first written for See It Markets.com. To see the original post CLICK HERE.
