
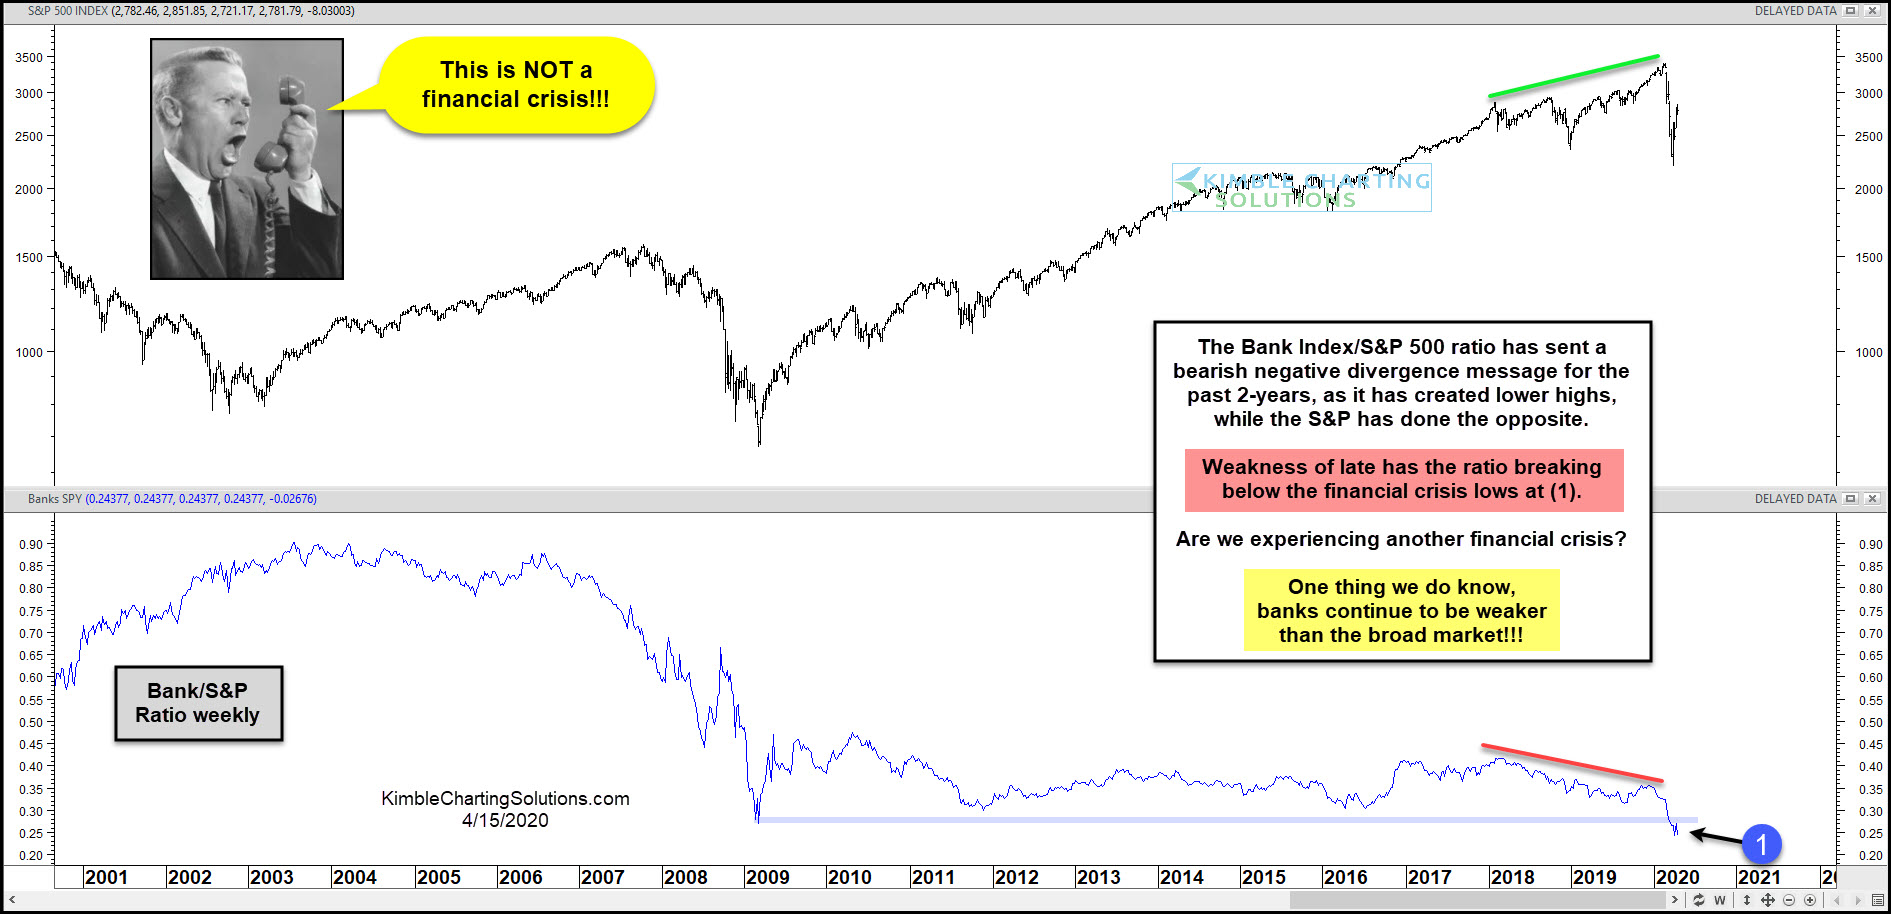
S&P 500 Index (top pane) vs Bank Index to S&P 500 Ratio (lower pane)
As most investors know, the banks play a big role in the overall economy. Healthy banks tend to mean a healthy economy and struggling banks tend to mean an uneven or faltering economy.
In today’s chart 2-pack, we highlight the weakness in the Bank Index and what it signaled early on… and may be signaling now.
As you can see, the Bank Index to S&P 500 ratio has sent a bearish negative divergence message for the past 2 years, creating lower highs while the S&P 500 created higher highs.
After the March stock market crash, the banks have shown further weakness, with the ratio breaking below the financial crisis lows at (1).
The banks continue to be weaker than the broad market and that’s not a good thing. Bulls need to see the banks begin to outperform or they could risk giving back recent gains.
This article was first written for See It Markets.com. To see the original post CLICK HERE

What do the four largest bear markets in the past 100-years have in common? In this Kimble Shorts video, we analyze historic bear markets and compare them to the price action of this year.
See our thoughts in this video and how to take advantage of our 40-year anniversary special.
