
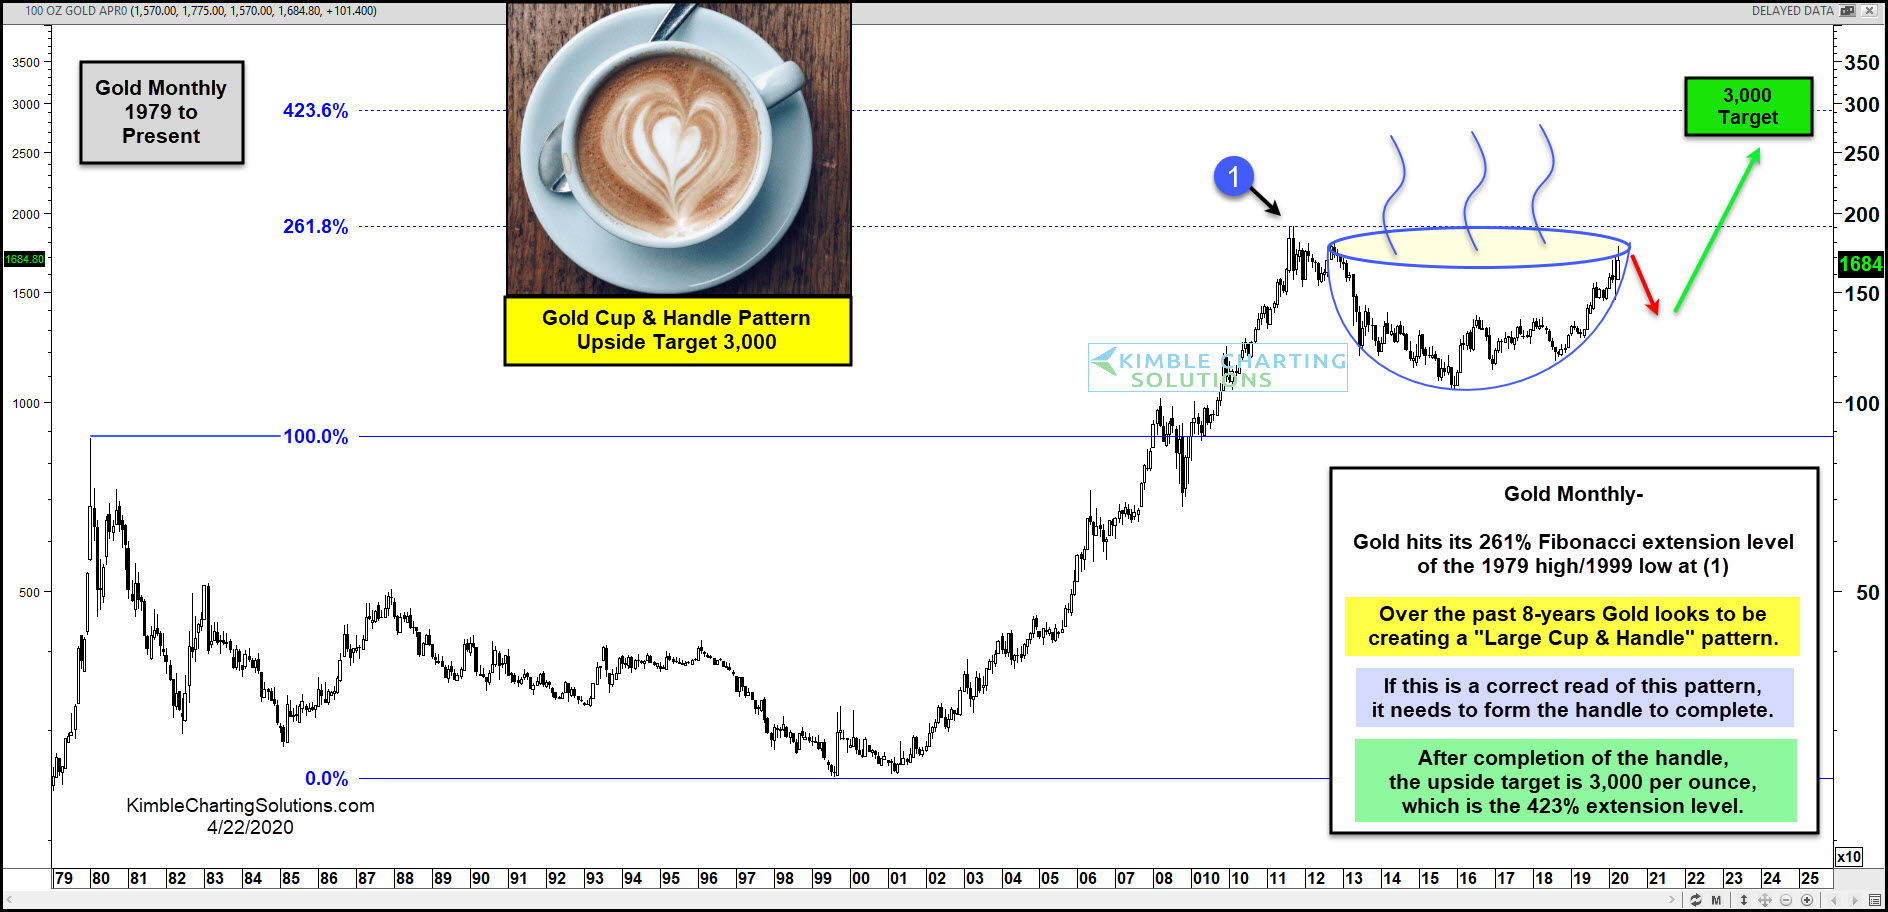
In 2011, Gold bugs were gushing with bullish sentiment as Gold prices rallied sharply before peaking around $1900.
That peak formed at the 261.8 percent Fibonacci extension of the 1979 high / 1999 low at (1) on today’s chart.
The next 8 years saw Gold prices enter a bear market before bottoming and turning higher in what could be a cup and handle pattern setup.
This pattern has the attention of gold bulls. Now all we need to see is a handle form for this to pattern to be complete. That would entail a pullback and rally higher.
Should this pattern form and lead to new highs, it could then target $3000 (the 423.6 percent Fibonacci extension).
This article was first written for See It Markets.com. To see the original post CLICK HERE.
Stock Patterns of late look very similar to the 1987 crash! Could the actually be bullish for stocks? YES!!!
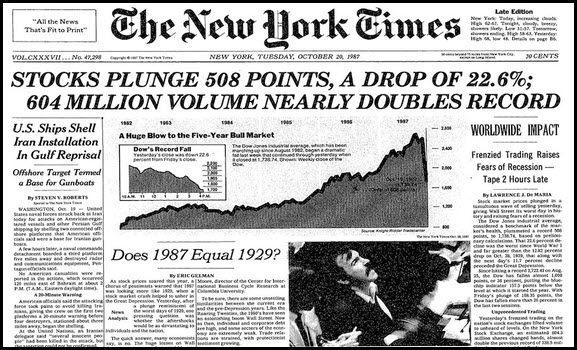
I did a Kimble Shorts video on this topic, that goes into deeper detail about the similarities between 1987 and 2020….CLICK HERE TO WATCH THE 10 MINUTE VIDEO
