
Last week’s sharp rally off the lows, gave bulls some relief.
But if the bulls are going to have reason to cheer, they will need to see another move higher… and fast!
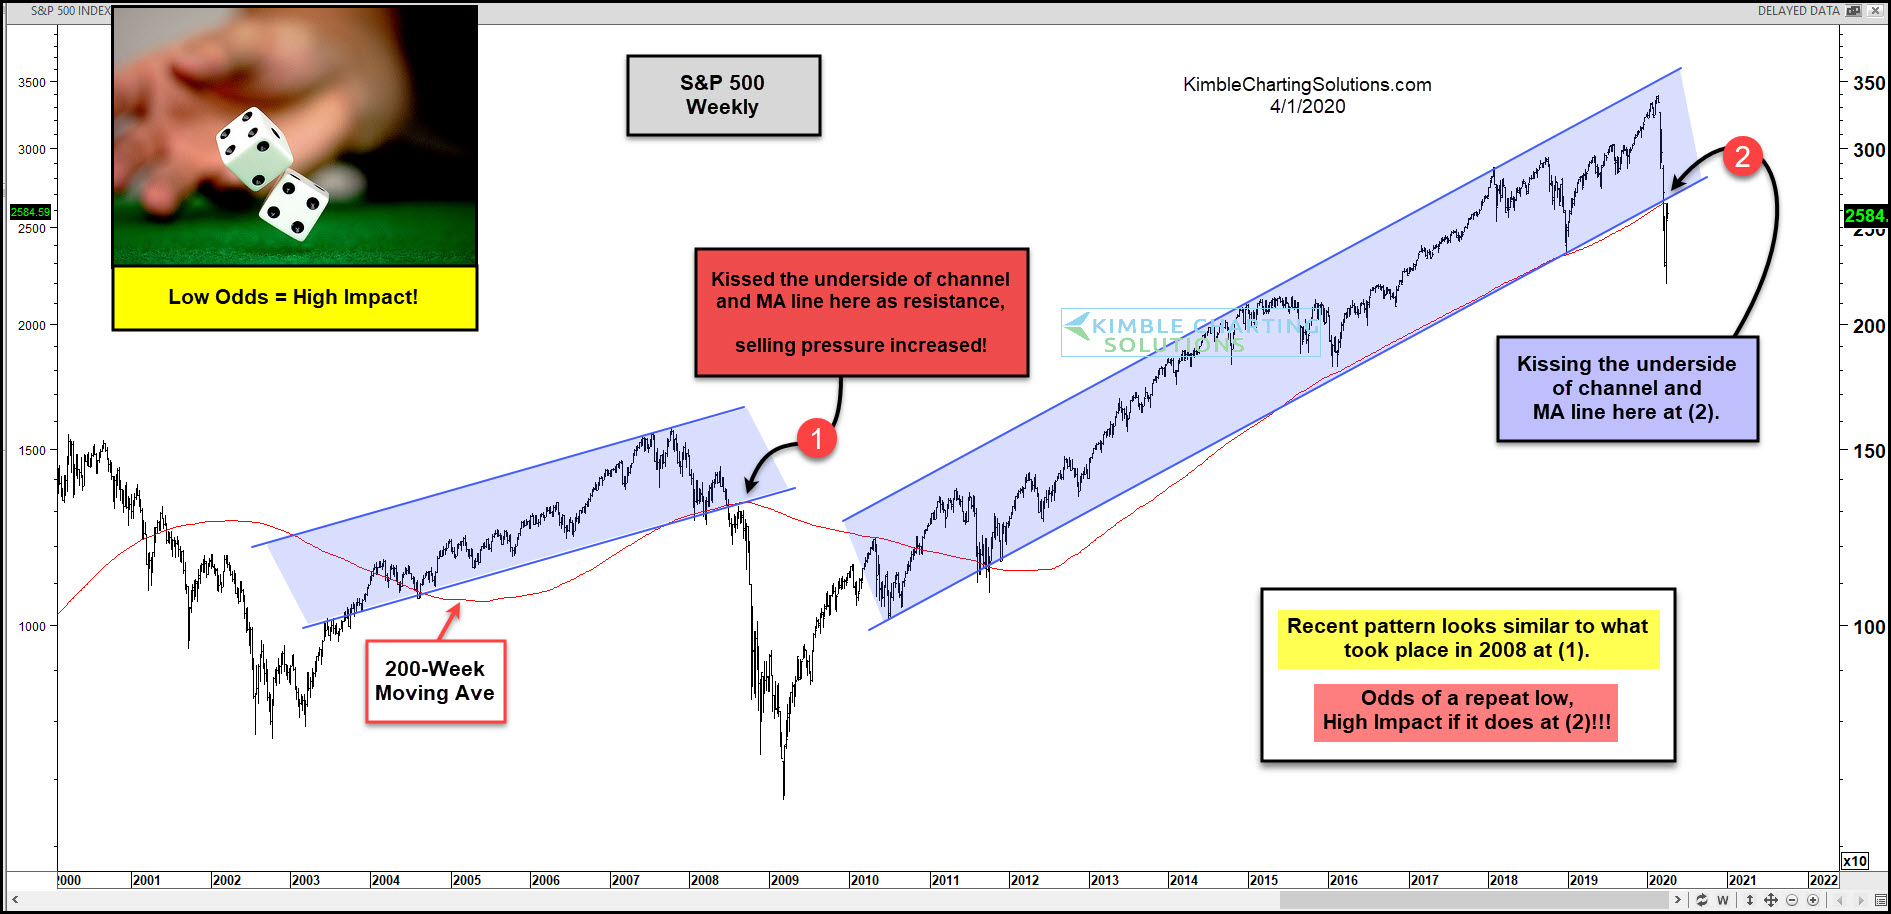
Why? Just look at today’s “weekly” price chart of the S&P 500 Index.
This key broad-based index broke a 10-year bull market trend line in March. And it’s now kissing the underside of the trend line at (2).
The last stock market crash saw a similar pattern in 2008. And after a failed “kiss” of resistance at (1), selling pressure accelerated.
Sometimes things don’t “repeat”, but rather “rhyme”. Will we see selling pressure pick up?
This article was first written for See It Markets.com. To see the original post CLICK HERE.
