
When fewer and fewer stocks are holding up a market, could that end up sending a bearish message to stock market bulls? Yes.
This ratio looks at the NDX 100 index compared to the Nasdaq Composite Index. The ratio compares the strength of the 100 largest tech stocks (NDX) to the strength of 3,300 tech stocks (Nasdaq composite Index).
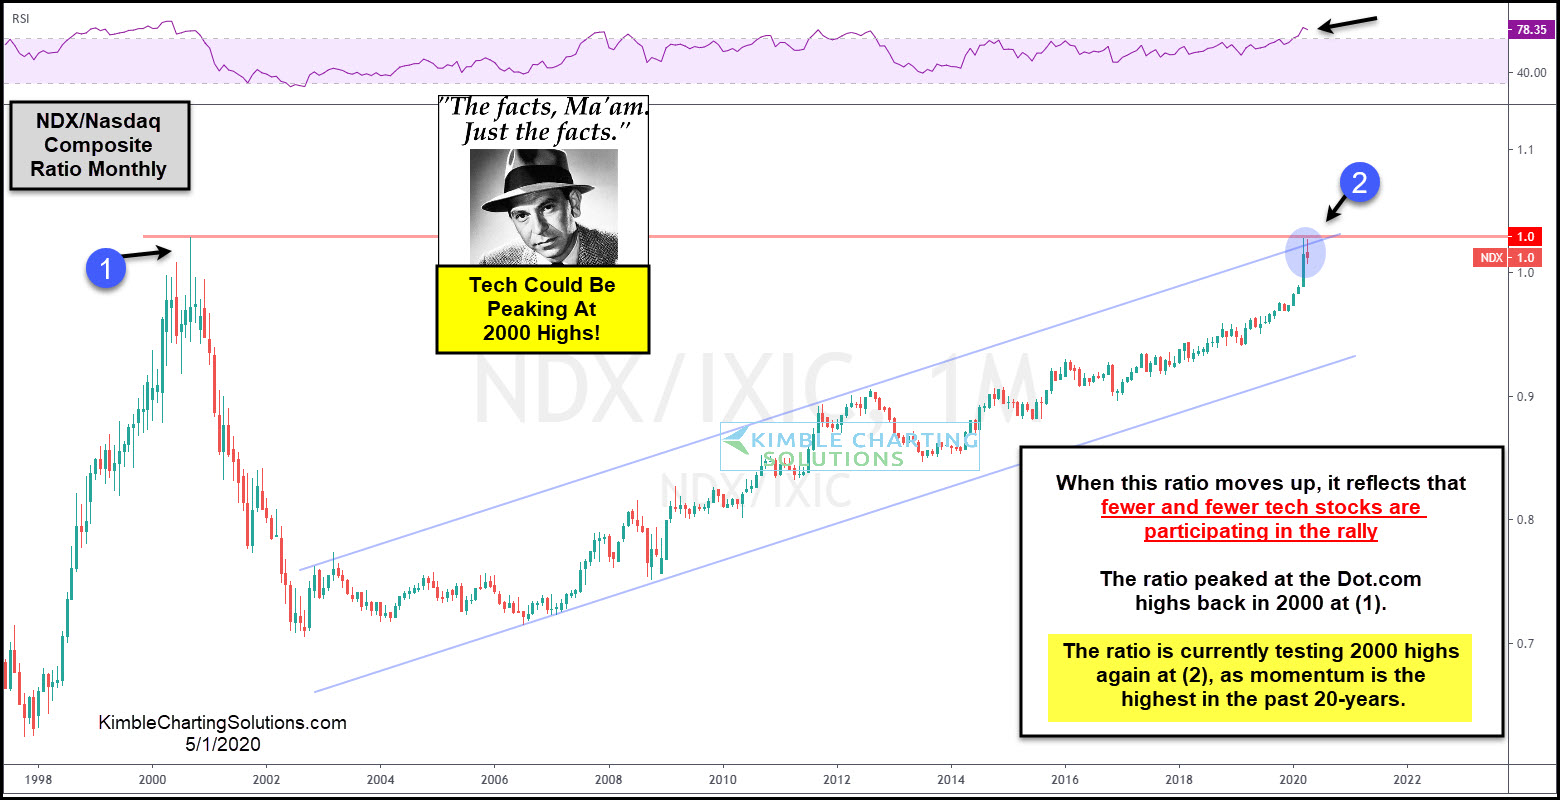
When the ratio is rising it is reflecting the largest tech stocks are doing much better than the majority of tech stocks. When the ratio peaked in 2000 and rolled over, the Dot.com boom ended at (1). The ratio has been moving higher since the lows back in 2002.
The ratio remains in a bullish trend as it has created a series of higher lows and higher highs inside of this rising channel since the 2007 lows. The long-term rally has the ratio currently testing the 2000 highs and the top of this rising channel at (2), as momentum is currently the highest in the past 20-years.
No doubt the trend in the ratio is higher, which continues to reflect that the largest of the large tech stocks are providing the majority of the gains in the tech sector.
While testing the 2000 highs and the top of the channel, the ratio over the past two months could be creating back to back bearish reversal patterns, as it kisses the underside of dual resistance at (2).
Joe Friday Just The Facts Ma’am; If the ratio starts turning weaker at dual resistance, it would reflect that the largest tech stocks (FAANG stocks) are struggling, which would send a concerning message to all tech stocks and the broad market as well!
What happens at (2), a breakout or breakdown, will send a very important message to the broad markets for months to come!

We put together this video details what the four largest bear markets of the past 100-years looked & acted like. CLICK HERE to watch this video.
In honor of my 40th anniversary in the business, check out how to receive 40% off our most popular research reports.
