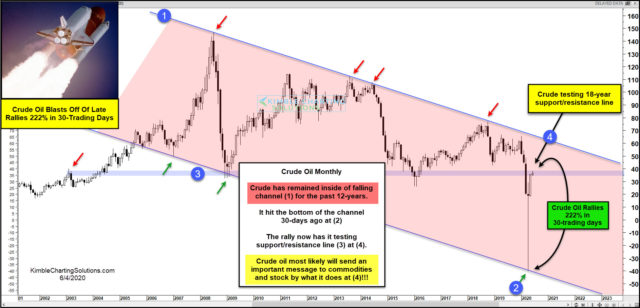
Can you believe that Crude Oil has rallied 222% in the past 30-trading days?
It’s hard to believe that Crude Oil is trading nearly $75 off its lows, yet the current price is around $36!
The chart looks at the Crude Oil continuous contract on a monthly basis for the past couple of decades.
Crude has spent the majority of the past 12-years inside of falling channel (1). The collapse in Crude Oil prices in April saw it hit the bottom of the channel at (2), where it created a large bullish reversal pattern. Since hitting the bottom of the channel, Crude is up over 200%.
The strong rally has Crude currently testing the underside of 17-year support/resistance line (3), at (4). Despite the massive rally over the past 30-days, the long-term trend for Crude Oil remains down.
What Crude Oil does at (4), will most likely send an important global message to the commodities sector and the stock market as well!


