
China ETF (FXI) has been “Red Hot” of late? Is it about to run out of steam or will it remain on fire going forward?
This chart of FXI comes from Investors Business Daily and Marketsmith.com. It reflects that FXI is above key long-term moving averages and its RS ratings is moving sharply higher of late.
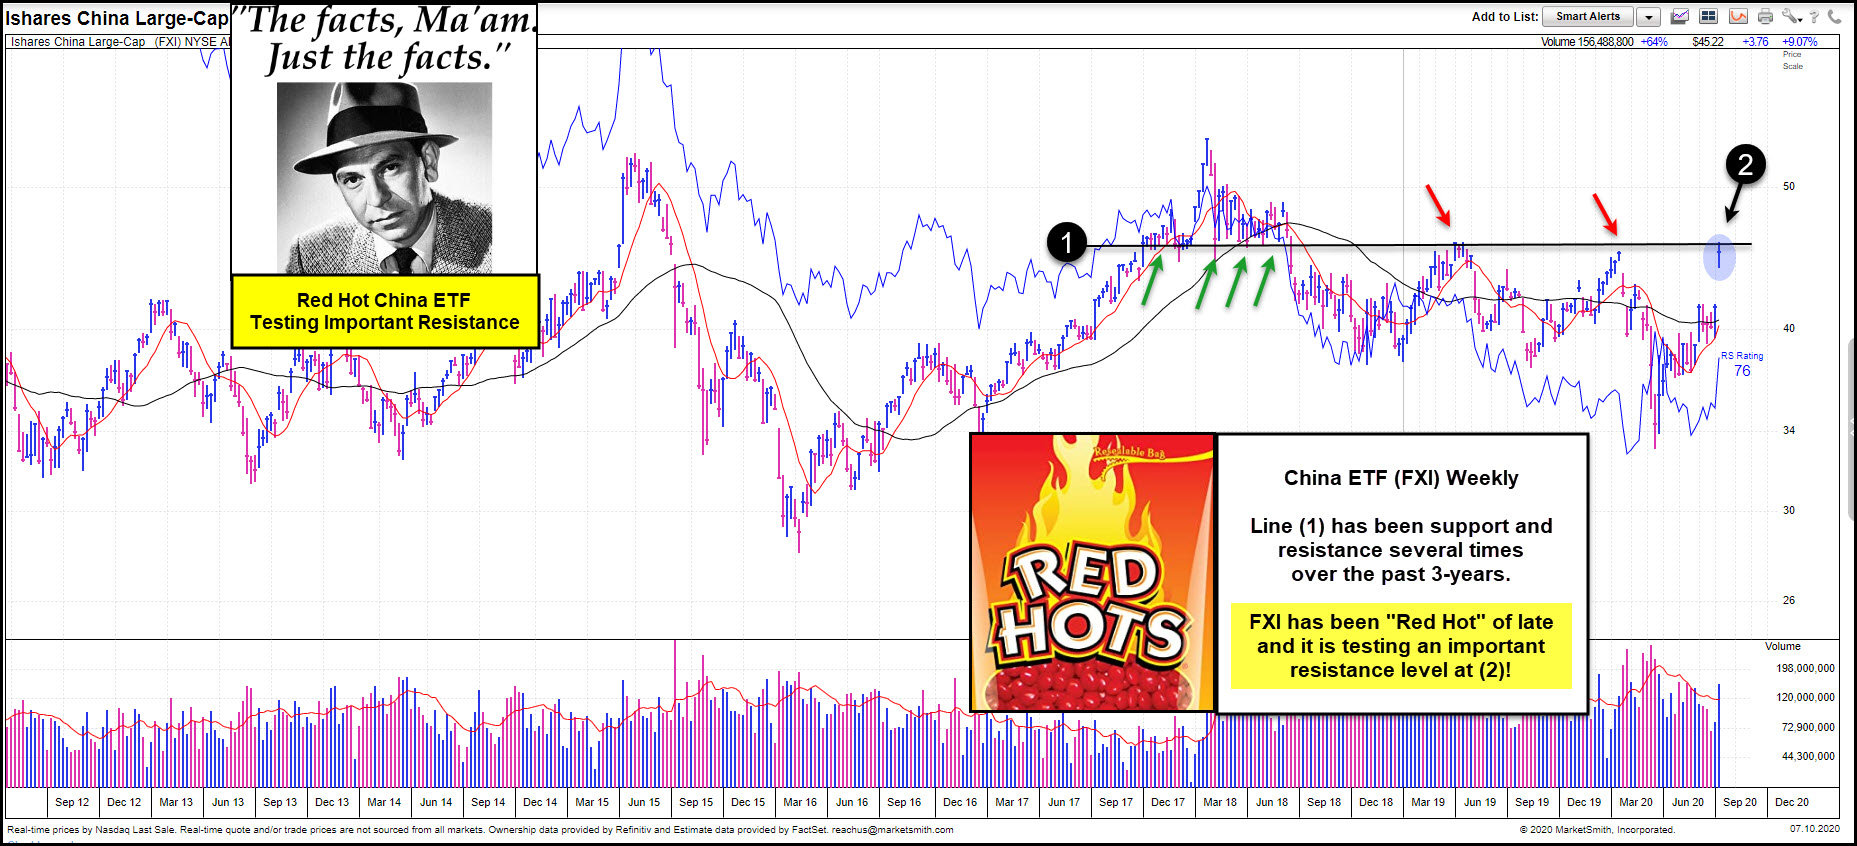
Line (1) has been support and resistance several times over the past 3-years. The rally of late has FXI testing this key line in the sand at (2), which comes into play as resistance..
Joe Friday Just The Facts Ma’am; FXI is testing key resistance at (2). In the past 15-months, FXI has kissed the underside of this line, failed to break out, and then it declined at least 10% quickly.
Will the third test of resistance result in an upside breakout? If so, look for it to remain red hot for a while and tack on another 10% to the upside!
