
Last month, I featured this Gold / US Dollar ratio chart in an article warning of the potential for a trend reversal.
While the broader bullish trend is still intact (higher lows since 2015), it could be time for Gold to take a breather.
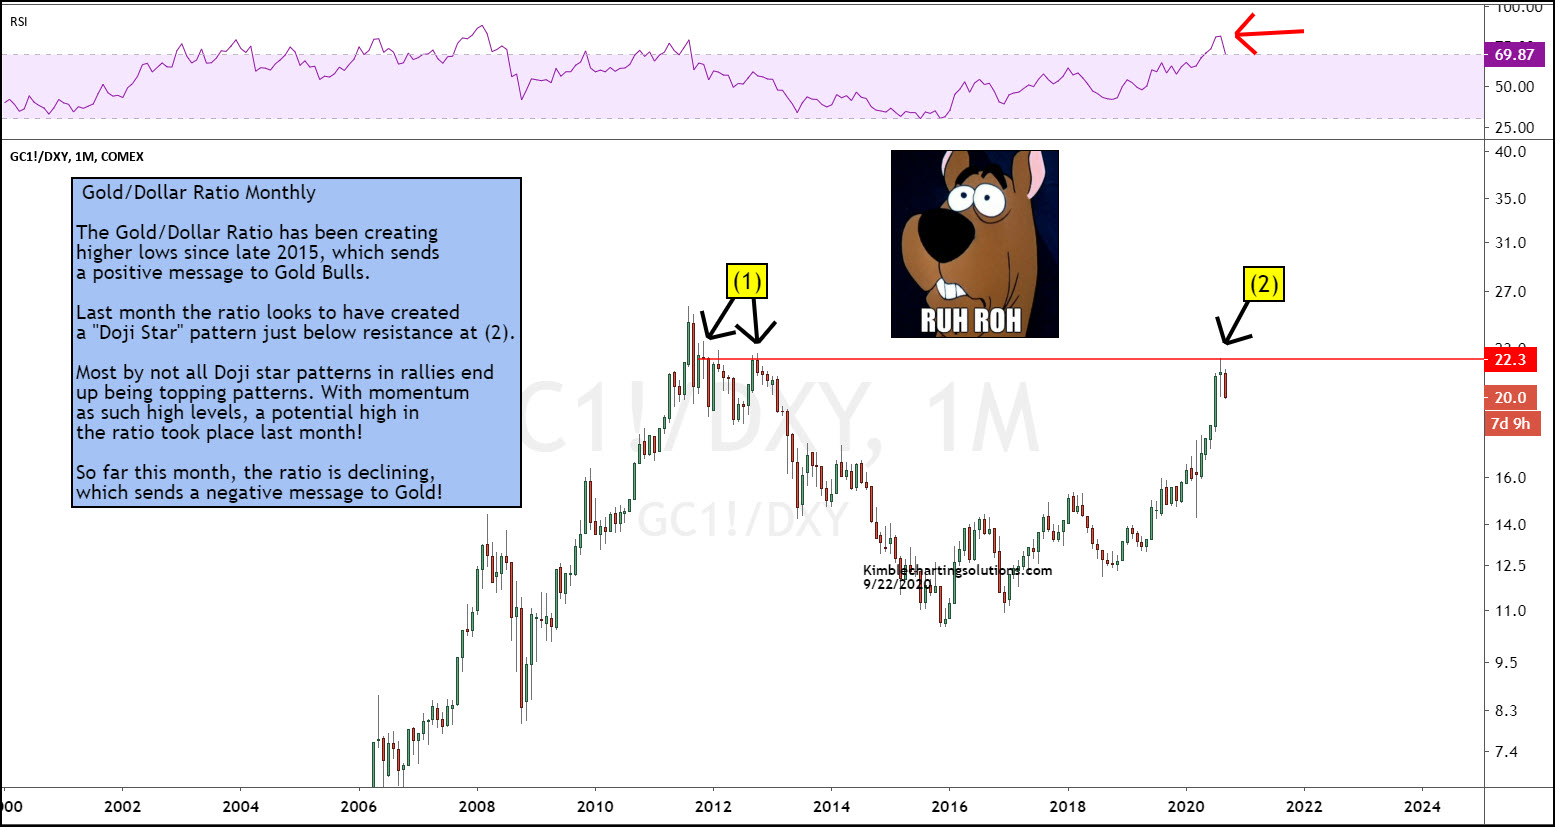
Looking at today’s “updated” chart, we can see that the ratio formed a “doji star” candle last month with momentum running at peak levels (concerning). And this month we are seeing follow through to the downside (in the form of a red candle).
As well, this bearish reversal pattern comes at a key long-term price resistance level, marked by (1) and (2).
Keep an eye on this doji star topping pattern. This month’s decline is sending a concerning message to Gold bulls!
This article was first written for See It Markets.com. To see the original post CLICK HERE.
