
The price of crude oil has been an important indicator of the economy for quite some time. When oil is in demand and performing well, the economy likely is. And when oil is not performing well, the economy likely isn’t either.
Taking this one step further, it’s easy to see how crude oil can be a solid indicator of the stock market as well.
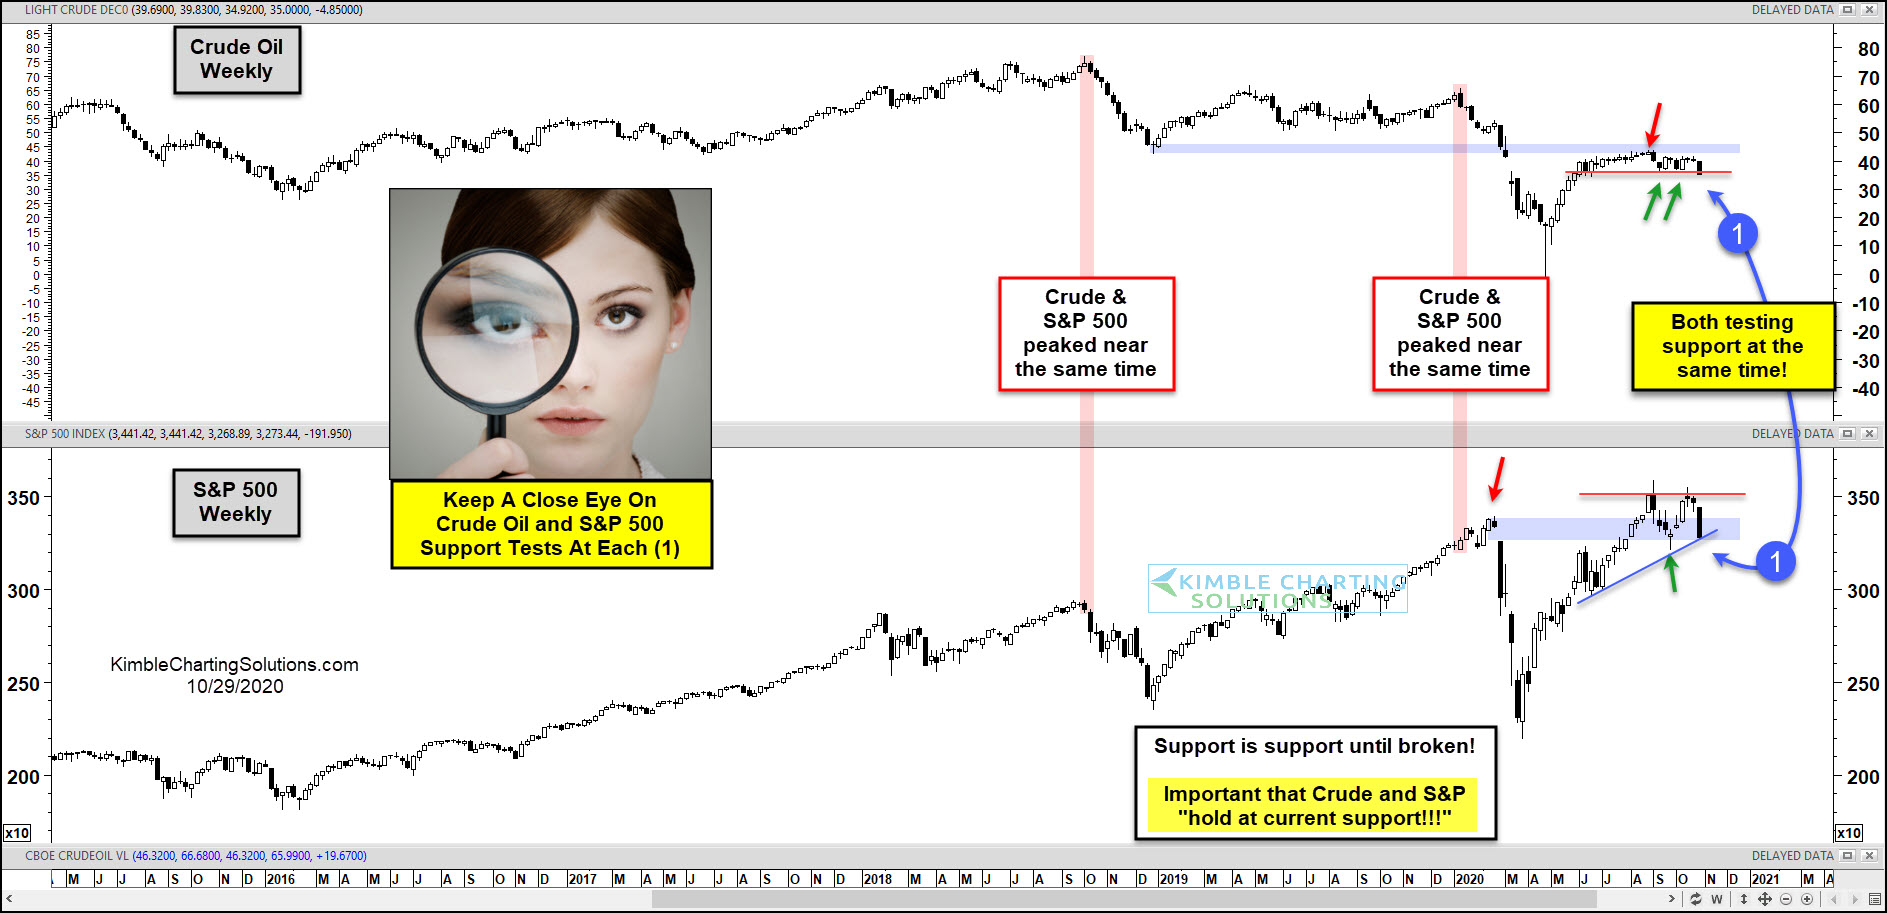
Often times, investors receive a bearish or bullish message from this relationship. In today’s chart 2-pack, we illustrate how the relationship between the S&P 500 Index and the price of Crude Oil warned investors in 2018 and 2019… and may be warning them again today!
As you can see on the chart, the price of Crude Oil and the S&P 500 Index peaked around the same time in 2018 and 2019. These reversals lower lead to big declines. More recently, oil tested the underside of major resistance before heading lower to test support at (1). And the S&P 500 created a potential double top at resistance before reversing lower to testing important up-trend support at (1).
Needless to say, it is important that Crude Oil and the S&P 500 hold support at (1)… or we could see a big selloff. Support remains support until broken!
This article was first written for See It Markets.com. To see the original post CLICK HERE.
