
Stock market volatility has turned higher as the month of October has wore on. And now that we are just one week away from the elections, it appears that investors are showing their uncertainty through the price action on the major U.S. stock market indices.
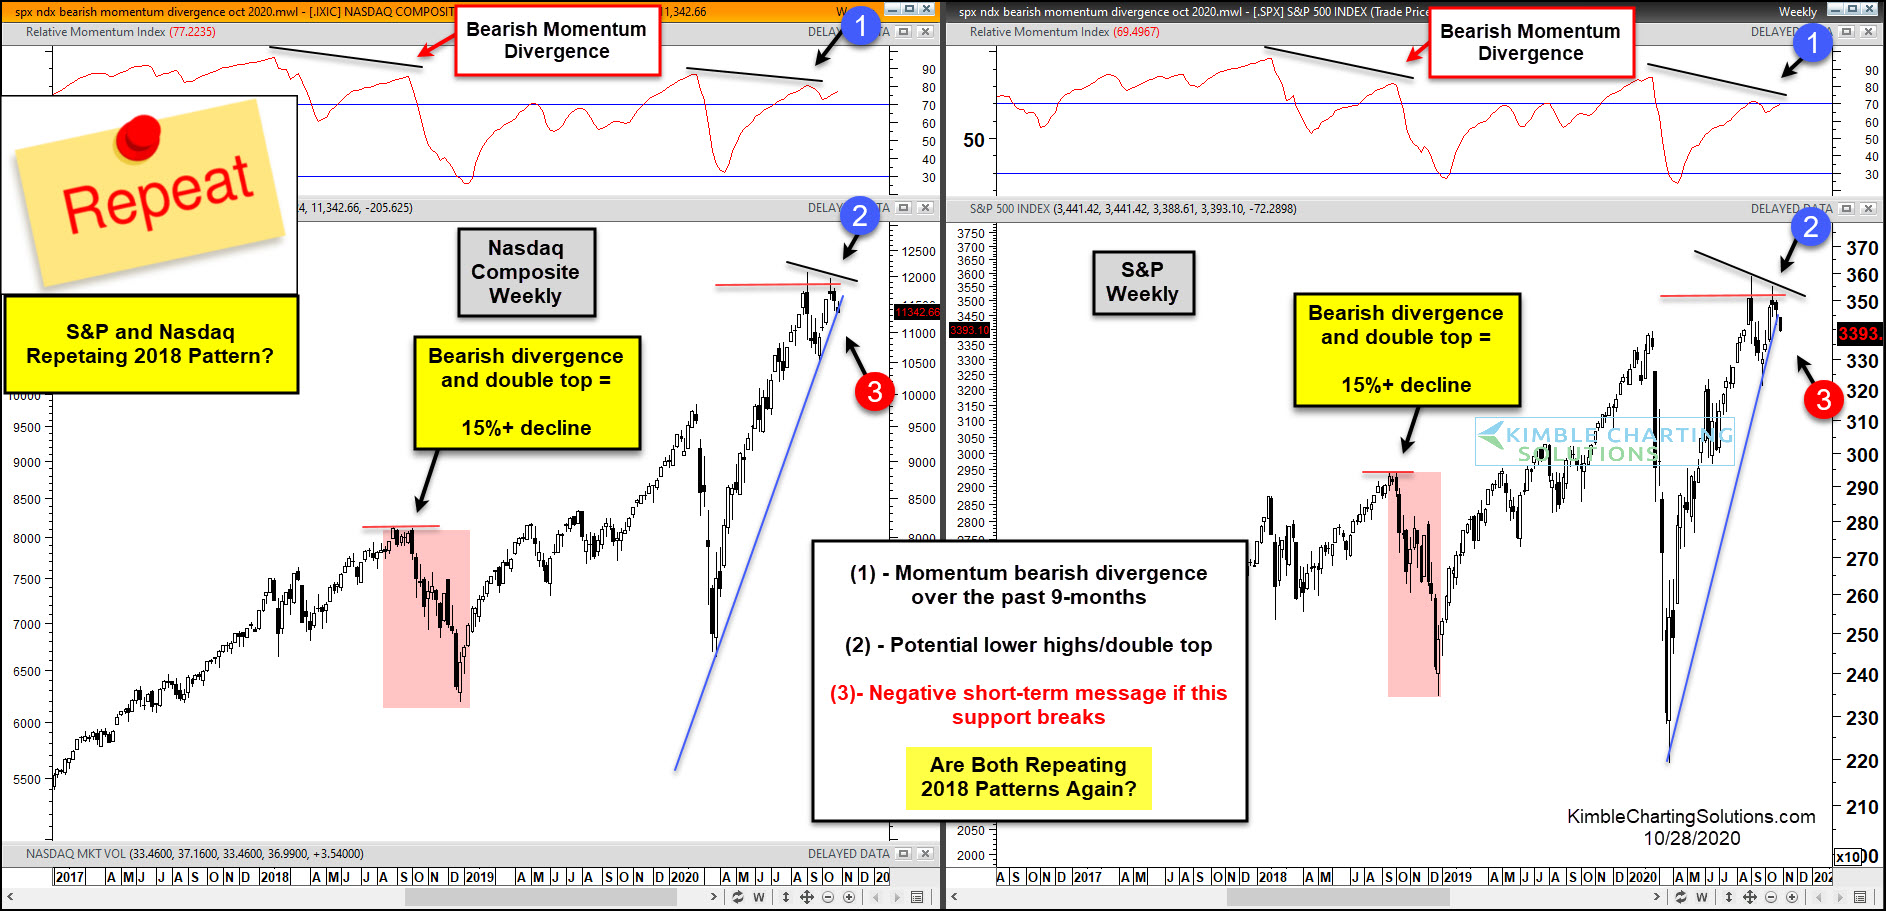
In today’s chart 2-pack, we look at “weekly” charts of the Nasdaq Composite and S&P 500 Index. Though not the same, they have a similar developing pattern. Perhaps one that leads to a 15%+ decline back in 2018.
Could History Be Repeating Itself?
Just as we saw in 2018, momentum is forming a bearish divergence this year at (1). That occurs when prices form a new high while momentum turns lower. We also have a similar lower high / double top pattern forming this year at (2) just as momentum wanes.
Lastly, price is testing important up-trend supports on both the Nasdaq Composite and S&P 500 Index. If this support breaks, it will send a negative short-term message just as it did in 2018. And if so, this could lead to another 15%+ stock market correction. Stay tuned!
This post was first written for See It Markets.com. To see the original article CLICK HERE.
