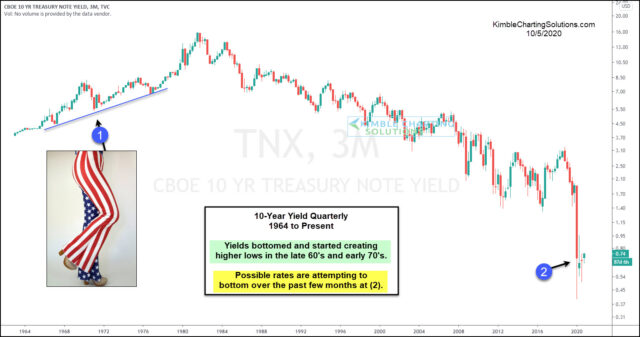
Are interest rates attempting to create a long-term bottoming pattern over the last 6-months? Possible!
This chart looks at the yield on the 10-year note, on a quarterly basis since the early 1960s.
In the late 1960s and early 1970s, yields started creating higher lows at (1), as they rallied from 4% to 15% in 15-years.
Yields have collapsed over the past few years, since double topping in 2013 and 2018, at the 3% level.
Yields created a large bullish reversal pattern in the first quarter of the year at (2). Since then a small rally in yields has taken place.
Is a long-term low in yields in place? It is too early to tell!
If the yield on the 10-year yield does rally above the .85% level, odds increase an important low in yields is forming!


