
When it comes to sectors that have stunk it up over the past decade, Energy ETF (XLE) wins the award!
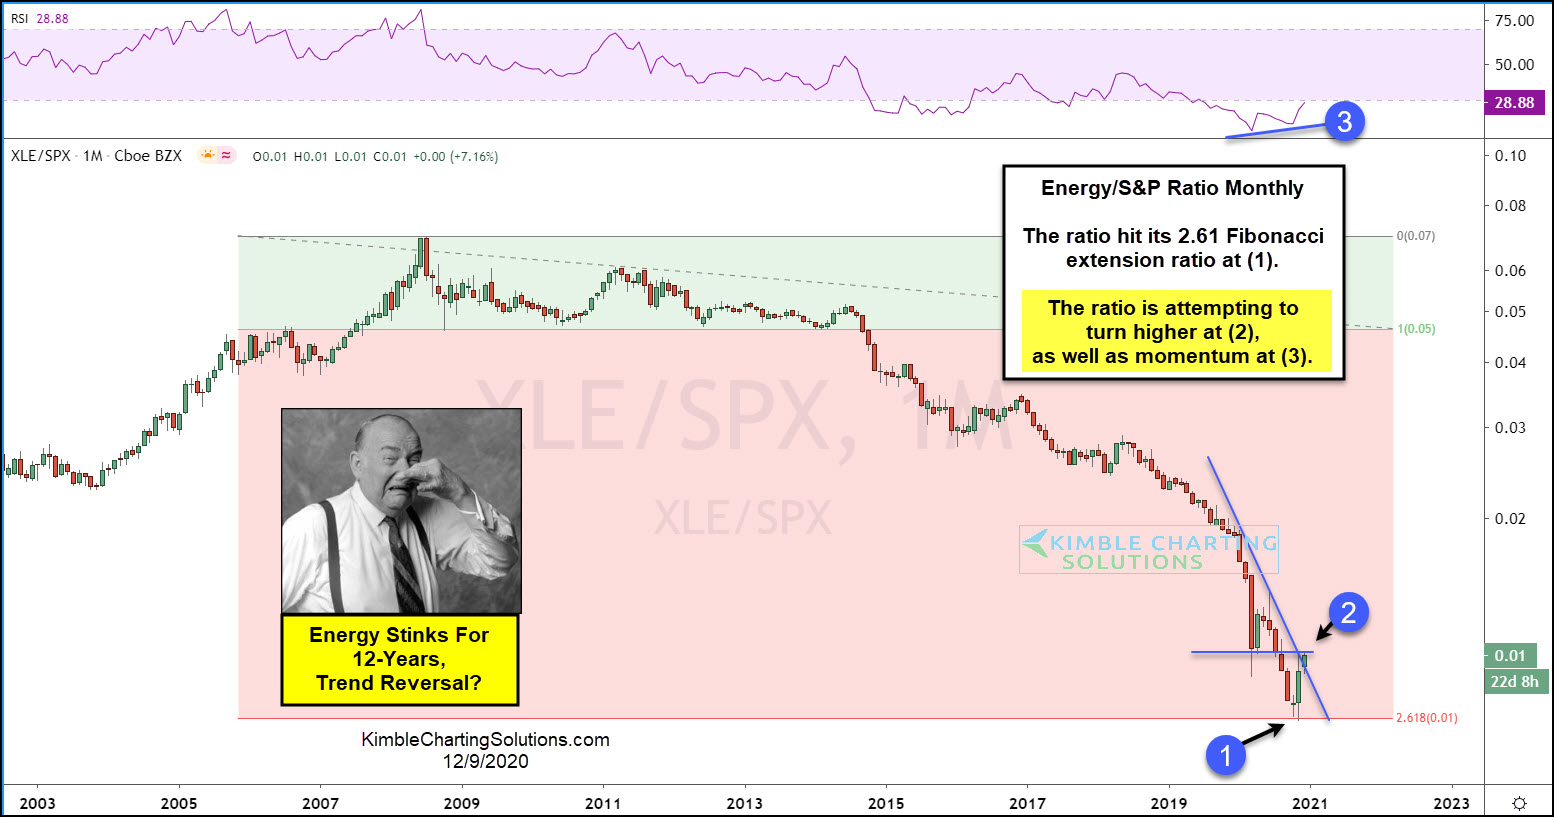
This chart looks at the Energy ETF (XLE)/ S&P 500 ratio on a monthly basis over the past 17-years. The ratio has been creating lower highs and lower lows since the highs in 2008.
Three months ago, the ratio hit its 2.61% Fibonacci extension level at (1). While hitting the lows it looks to have created a “Doji Star” reversal pattern.
The ratio has rallied since then and it is attempting to break above falling resistance at (2), as momentum is deeply oversold and looks to be creating higher lows at (3).
If the ratio is successful in breaking out at (2), this very out of favor sector would suggest it should provide positive relative returns to the S&P 500 for a while.
