
Do charts have memories? Can prices as far back as 45-years ago impact prices today? I understand if you answered both questions with a resounding no.
In my humble opinion, an important test of these questions comes into play at current prices in the S&P 500 at (1).
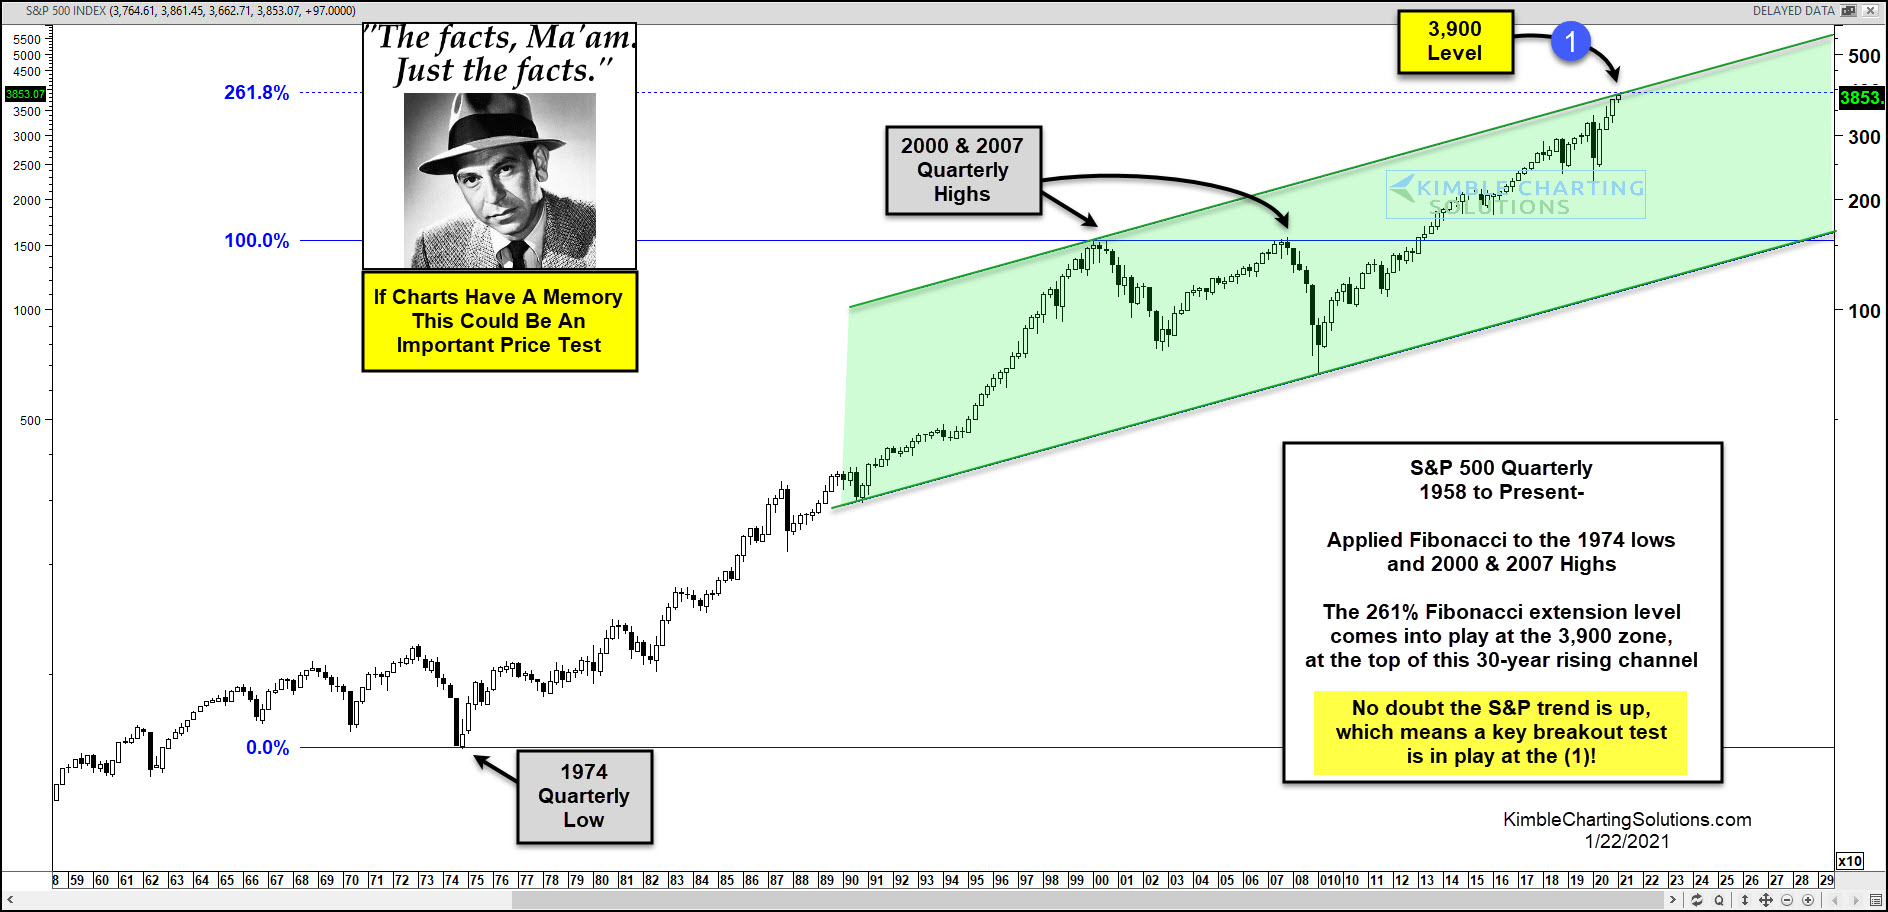
This chart looks at the S&P 500 on a quarterly basis since the late 1950s, where Fibonacci was applied to the 1974 lows and the 2000 & 2007 highs. The 261% Fibonacci extension level comes into play at (1), which is the 3,900 level in the S&P.
At the same time, this price test is coming into play, the S&P is testing the top of a 30-year bullish rising channel at (1).
Because a dual breakout test is coming into play at (1),
does it mean that a strong bullish trend has to come to an end? Nope!
One this is clear, should the S&P 500 breakout at (1), it sends a strong bullish message!!!
Joe Friday Just The Facts Ma’am; Bulls would receive a short-term caution message if selling would happen to start at the dual breakout test at (1).
