
Last November, we highlighted a cup and handle bullish pattern on Bitcoin that served as a base for a big rally. All together, Bitcoin rallied from roughly $4,000 last March to $64,000 this April! Wowsers!
BUT… since peaking in April, Bitcoin has fallen over 50% to roughly $29,000. Cryptocurrency trading isn’t for the faint of heart!
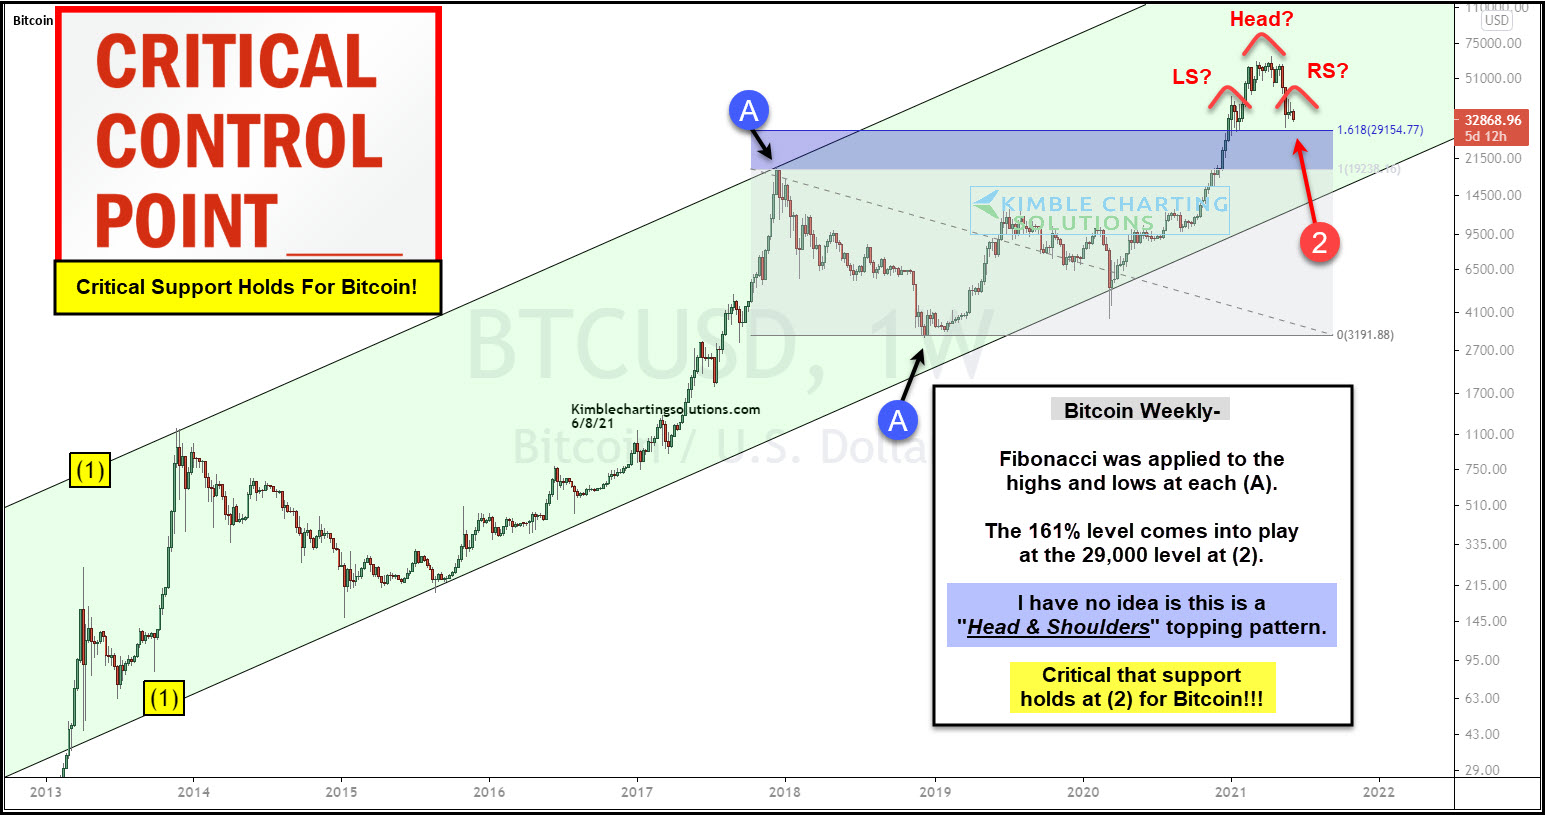
This brings us to today’s long-term “weekly” chart of Bitcoin and the potential for a topping pattern that could lead the cryptocurrency lower yet.
As you can see on today’s chart, Bitcoin has been in a long-term rising bullish channel marked by each (1). As well, we have a significant high and low within the channel at each (A). Using applied Fibonacci, we can see that the 29,000 level at (2) is the 161% Fib. This also marks the lows of the recent sharp decline.
As well, a pattern with the rough sketch of a head and shoulders top has taken shape. I have no idea if this is a true head and shoulders top… but, I do know that the recent lows and the 29,000 level are critical support for Bitcoin.
Odds favor this support level will hold at (2). If this support would fail, expect selling that would frustrate the bulls!!!
This article was first written for See It Markets.com. To see the original post CLICK HERE.
