Rising lumber prices have been a major source of inflation concerns. It’s one thing when the price of lumber doubles… and a whole other thing when it goes up 5-fold!
Yep, that’s right. Lumber prices have rocketed higher over the past 18 months, surging 5 times the COVID crash price low.
Something’s Gotta Give!
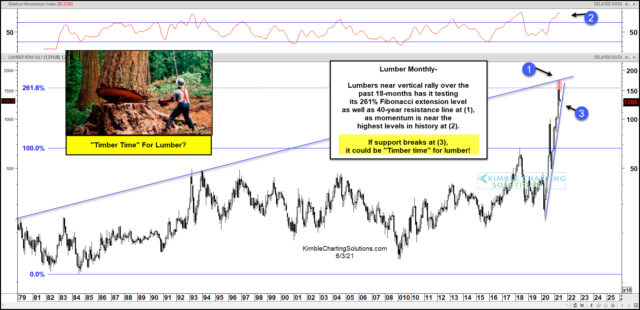
Today’s long-term “monthly” lumber chart highlights why there is a potential for a reversal / pullback in lumber prices over the coming weeks/months.
As you can see, the surge in lumber has price testing the 261% Fibonacci extension level, as well as the underside of the 40-year overhead rising resistance line at (1). Note as well that momentum is near its highest levels in history! Seems like a good area for a pause…
So how do we know if a pullback is underway? Watch that trend line! The steep up-trend line (3) offers short-term support. If it breaks, it could be “Timber Time” for lumber! Stay tuned!
The article was first written for See It Markets.com. To see the original post CLICK HERE.


