
The month of November was an ugly one for stocks.
Not because they closed lower but because of how they closed the month.
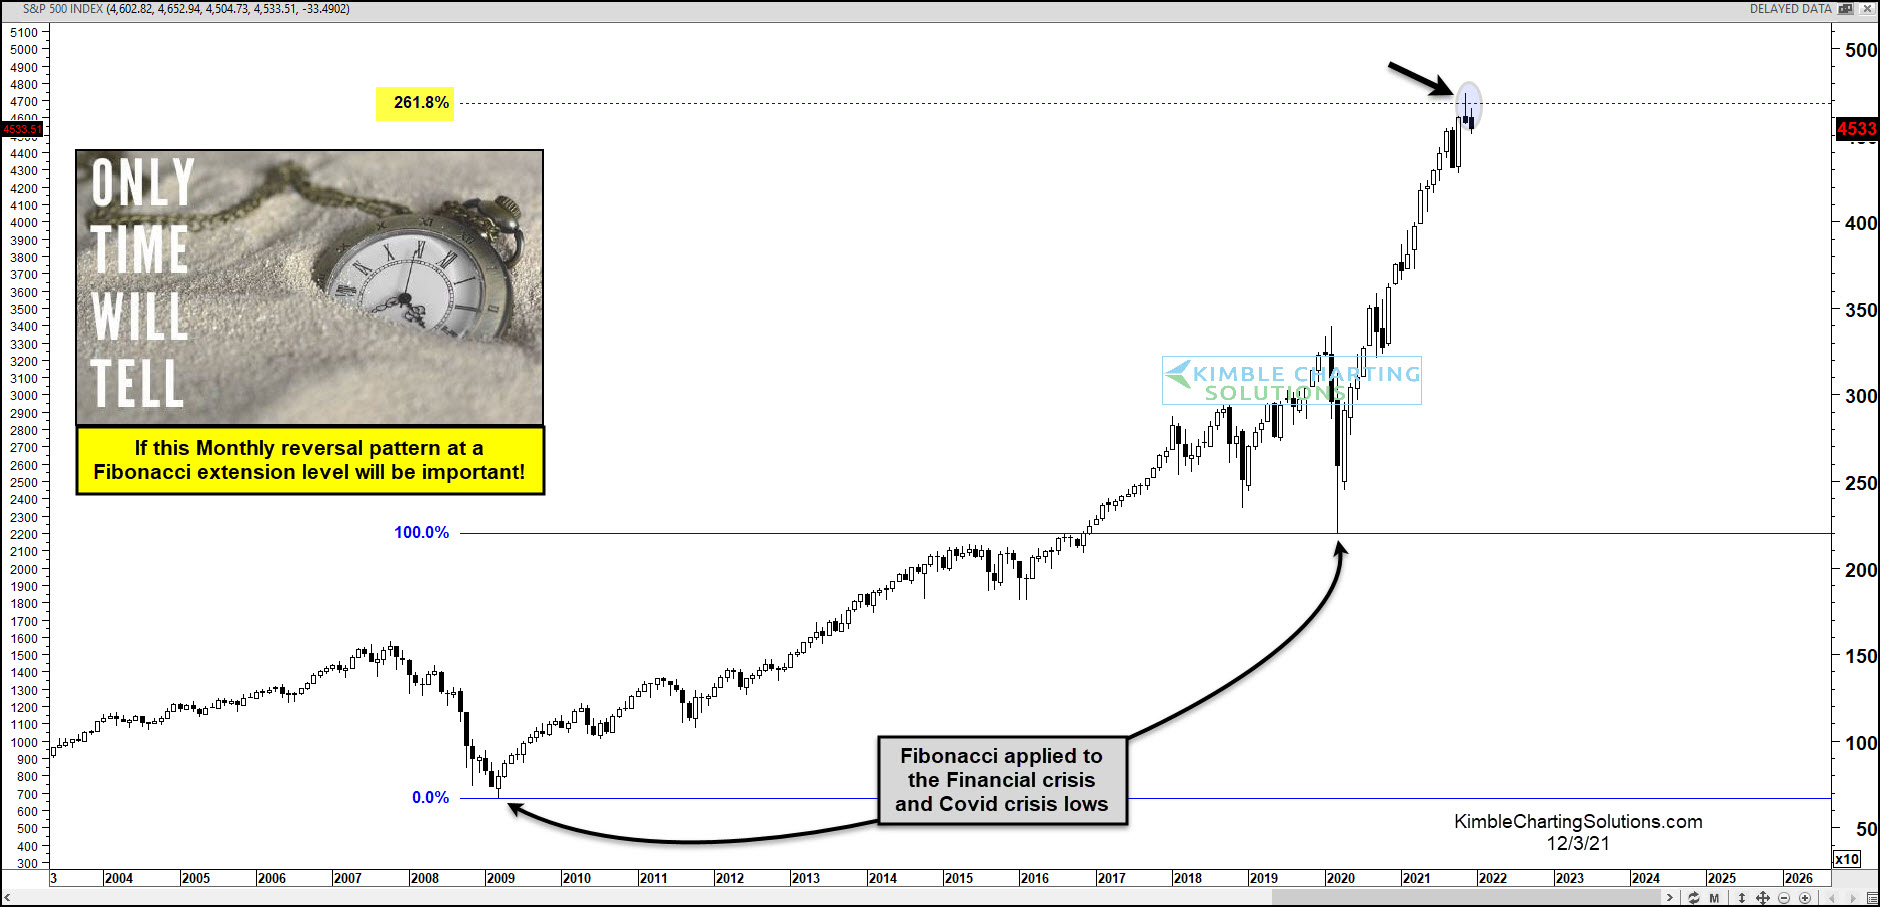
Today’s chart looks at the S&P 500 Index on a “monthly” basis and, as you can see, stocks made new all-time highs last month. So in that regard, November was a good month.
BUT stocks reversed lower intra-month and closed on the lows. This type of price action also created a bearish reversal pattern. And to make matters more important, this reversal also comes from a key fibonacci extension level: the 261.8% (using 2008 and 2020 lows).
The market paused here at an important Fib price point! Caution is advised, as investors must now be aware of how the market trades in the coming months. Further selling could bring a deeper correction. Stay tuned!
This article was first written for See It Markets.com. To see the original post CLICK HERE.
