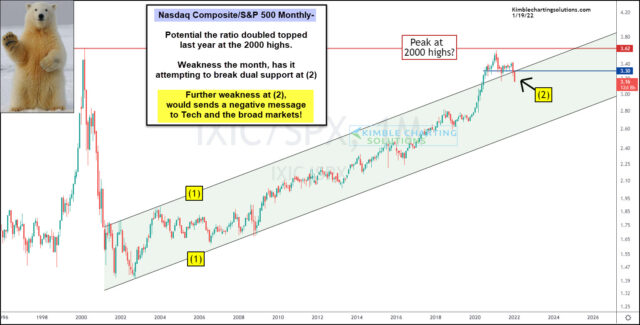
One theme over the past several months has been tech stock’s under-performance. And 2022 seems to be amplifying this theme as we kick off the new year.
Today’s chart focus is on the ratio of the Nasdaq Composite to the S&P 500 Index. We have shared this ratio a few times recently as the price pattern has become a concern.
As you can see in the chart, there’s a potential that the ratio double topped last year at the 2000 highs. And weakness this month has it attempting to break dual support at (2).
The good news is that the ratio is in a rising up-trend marked by each (1). This is long-term bullish. The bad news is that there’s room for a bigger decline if support at (2) breaks.
So, is the bear staring tech investors in the eyes?
Further weakness at (2) would send a negative message to technology stocks (and the broader market). Stay tuned!
This article was first written for See It Markets.com. To see the original post CLICK HERE


