Crude oil prices (and everything else) started rising with COVID and supply chain issues. And now that we are adding sanctions on Russia and no longer importing Russian oil, the stakes for inflation just went higher.
BUT what if this perfect storm created a scenario for “peak” oil?
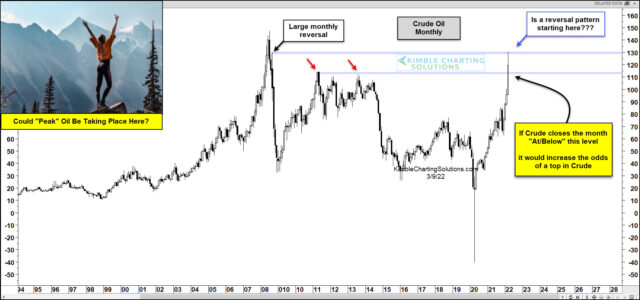
The month is still young, so we’ll have to monitor today’s long-term “monthly” crude oil chart through month-end. But, as you can see crude oil came in like a lion to start the month of March, surging up to $130 per barrel. That surge pushed oil prices up to the bottom of the bearish reversal bar that marked crude oil’s all-time high (top blue line).
Then crude reversed lower. As it stands, this month’s price candle may be in the midst of creating a bearish reversal.
So what should we be watching for?
Well, like I stated above, the month is FAR from over with. But should crude oil prices continue to head lower into month-end, then we all should be watching the 2nd blue line marked by two red arrows. This area marks resistance. And should crude close at or below this level, it would create a bearish reversal pattern… and this would increase the odds of a top taking shape in crude oil prices.
With all the geopolitical news in the world, it should be an interesting next few weeks. Stay tuned!
This article was first written for See It Markets.com. To see the original post CLICK HERE.


