One of the broadest stock market indices is flashing a warning sign. Is any one watching?
Joe Friday is.
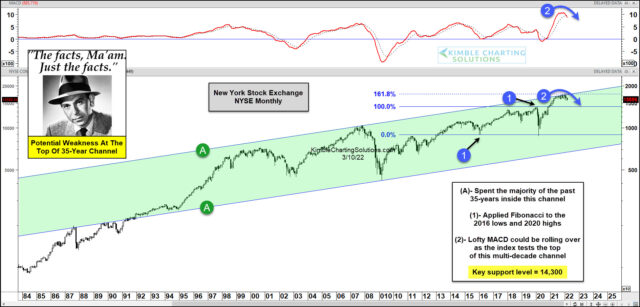
Today’s chart takes a long-term “monthly” view of the New York Stock Exchange (NYSE) and highlights why this stock market index is at risk of rolling over.
“The facts, Ma’am. Just the facts.”
As you can see, the NYSE spent the past 35 years in a rising trend channel marked by each (A). And more recently, price reached the top of that channel (resistance) and began to turn lower.
But this area turned out to be more than just channel resistance… it’s a major 1.618 applied Fibonacci extension level as well (when using 2016 lows and 2020 highs). And as the NYSE price hit this 1.618 Fibonacci level, the MACD (momentum) indicator hit some of its loftiest readings on record… and began to turn lower.
So with price and momentum turning lower from the top of a 35-year channel, it’s probably wise for investors to listen to Joe Friday! And stay tuned!
This article was first written for See It Markets.com. To see the original post CLICK HERE.


