
Today we share another important chart for the Semiconductors. Why? Because they are a market leader that has fallen on hard times this year.
And, as you may have noticed, we always bring to light the latest reversals and key tests of support/resistance in an effort to highlight potential trend changes.
Just last week, we shared a chart 2-pack looking at key trend line tests for the Semiconductors ETF (SMH). Today, we look at a harrowing pattern for the Semiconductors Index (SOX).
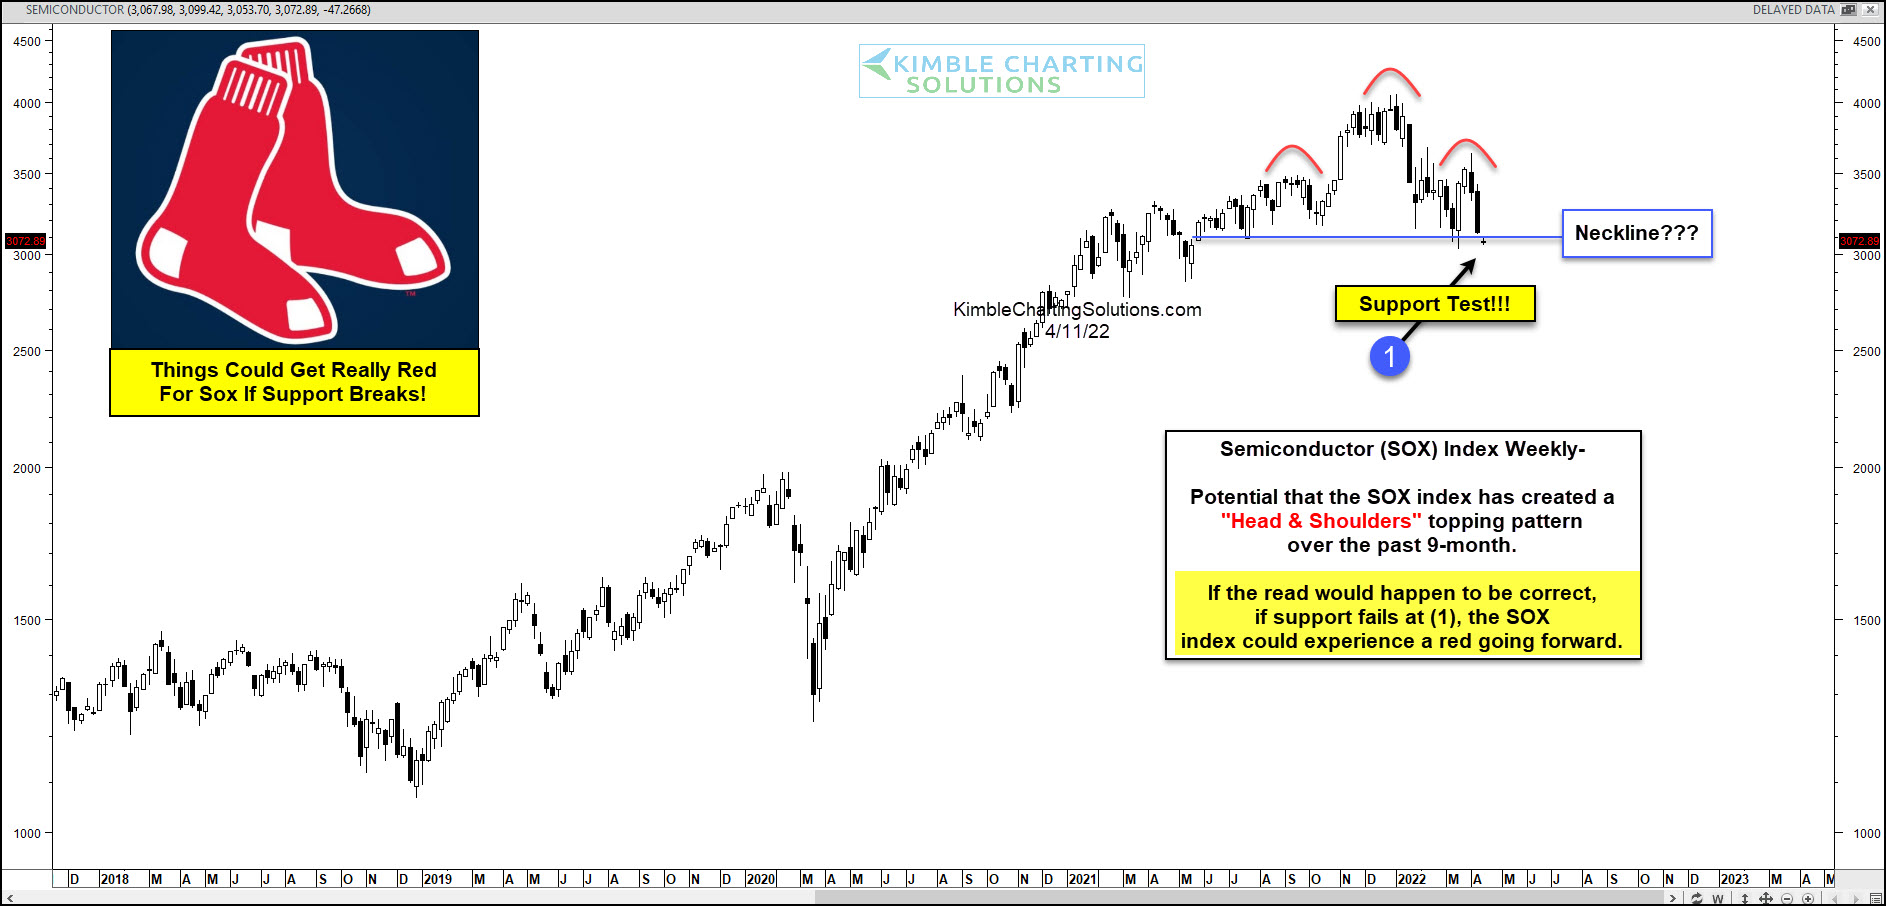
In the “weekly” chart of the $SOX, we can see that the Semiconductors Index has formed a head and shoulders pattern over the past 9 months.
And it is testing neckline support right now!
If this read would happen to be correct and support fails at (1), the SOX Index could experience a lot of red going forward. Time to watch the leader of all leaders for the past decade-plus… bulls better put up a fight or it could get ugly in tech land. Stay tuned!
This article was first written for See It Markets.com. To see the original post CLICK HERE.
