
There haven’t been many places to hide during this year’s stock market correction (bear market?).
And one of the last hiding places could be in trouble: Energy stocks. And more specifically, the Oil and Gas Exploration Sector ETF (XOP) and the Oil Services ETF (OIH).
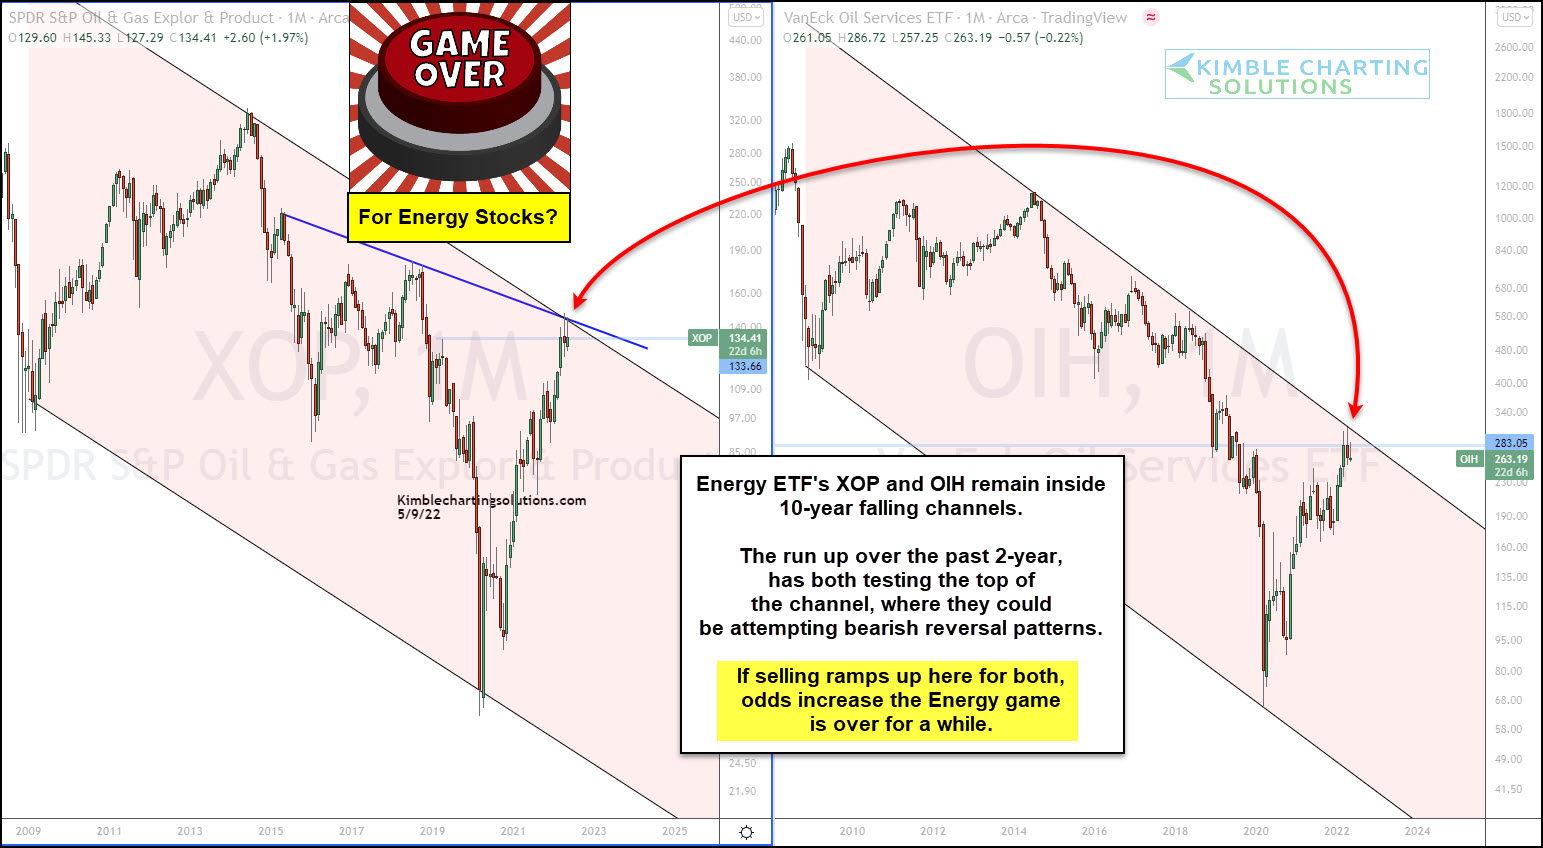
In today’s chart 2-pack, we look at $XOP and $OIH and highlight why they are trading at key junctures.
As you can see in the charts below, both ETFs are trading within falling channels. And both ETFs are testing the upper end of the falling channel after big 2-year rallies. We can also see that both Oil ETFs have produced long topside wicks, warning of potential bearish reversal patterns.
If selling ramps up here for both, the odds increase that the Energy game is over for a while. And that would be bad news for investors hoping the market correction ends soon.
If both break out from these 10-year falling channels, large upside potential. Big test for these Energy plays!!!
This article was first written for See It Markets.com. To see the original post CLICK HERE.
