
Seems the ‘Metals’ arena may be nearing a bigger move.
Earlier this week, we touched on precious metal Silver, and now we will turn our attention to the industrial metal Copper.
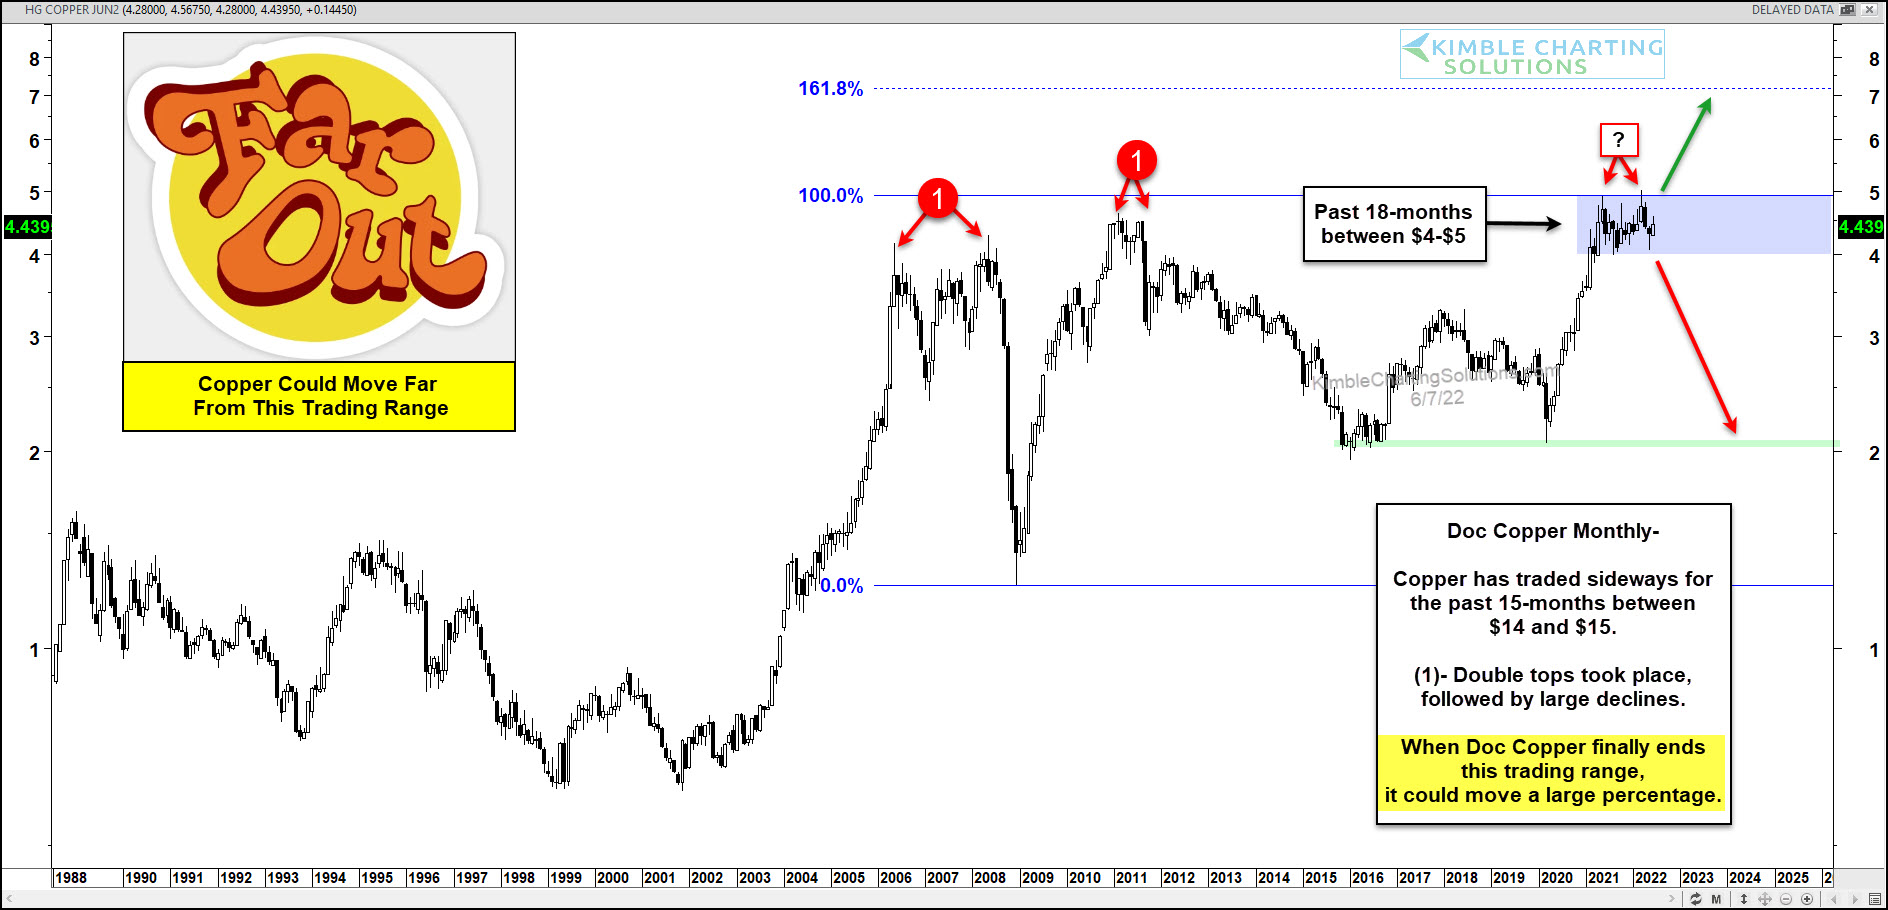
Today’s chart is a long-term “monthly” chart of Copper, highlighting why we may be at an important juncture.
As you can see in the chart below, copper has produced a couple of double tops at each (1), as well as some considerable bounces off price support (green line).
Right now, copper is testing resistance. It’s still in question whether the two longer wicks will produce a double top, or whether this is part of a bullish consolidation construct between $4 and $5.
If it’s a double top, copper could see a large decline. But if it’s bullish consolidation, ethnically copper could be headed to the 1.618 Fibonacci extension up near $7.
This is shaping up to be another important metals situation. Which way will copper break? Stay tuned!
This article was first written for See It Markets.com. To see the original post CLICK HERE.
