Several times we have highlighted the under-performance of tech stocks.
However, now more than ever do tech stocks need to reverse their misfortune.
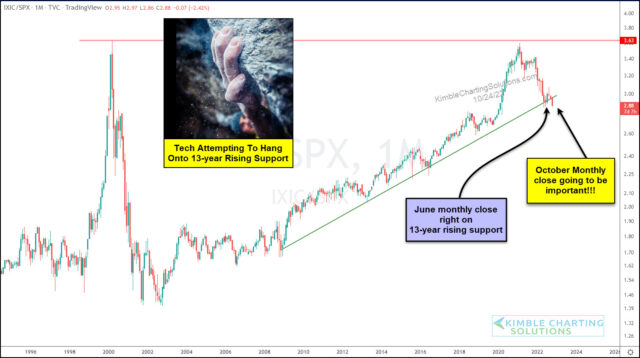
Today, we look at a long-term “monthly” chart of the ratio of the Nasdaq Composite to the S&P 500 Index.
As you can see, the trend has been higher for well over a decade. BUT this out-performance turned into significant under-performance over the past 18 months… and the ratio is now attempting to break below its 13-year rising trend line. In fact, October is currently trading below it!
This will be an important monthly close for tech bulls. Can the Nasdaq/S&P 500 ratio hold on to critical support? Stay tuned!
This article was first written for See It Markets.com. To see the original post CLICK HERE.


