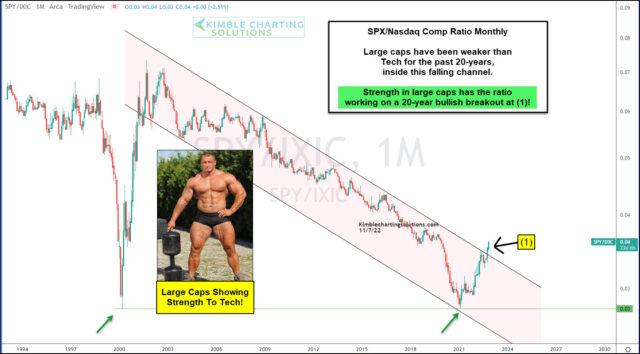
For the past two decades, the S&P 500 Index has underperformed the Nasdaq as tech stocks have been all the rage.
Growth and innovation has transformed our economy and kept those companies (and stocks) firmly in a position of leadership.
But is tech leadership about to be up-ended?
Today’s chart looks at the long-term “monthly” relationship (ratio) of the S&P 500 to Nasdaq. As you can see, the S&P 500 Index has underperformed the Nasdaq for nearly 2 decades!
BUT the broad large cap index has been out-performing the nasdaq for several month and the ratio is breakout out of its downtrend channel at (1). This comes after a potential double-bottom formation. Are large caps set to out-perform tech stocks in months/years ahead? Stay tuned!!
This article was first written for See It Markets.com. To see the original post CLICK HERE.


