The past 5 days have seen another strong wave of selling across tech and growth stocks.
Even more alarming is that tech stocks continue to underperform the broader market. And, as I have said many times, tech stocks have been a market leader for two decades… so it goes without saying that investors should follow tech stocks performance as a bull/bear indicator.
In short, bulls want tech stocks to begin outperforming. Sadly, that is not the case yet.
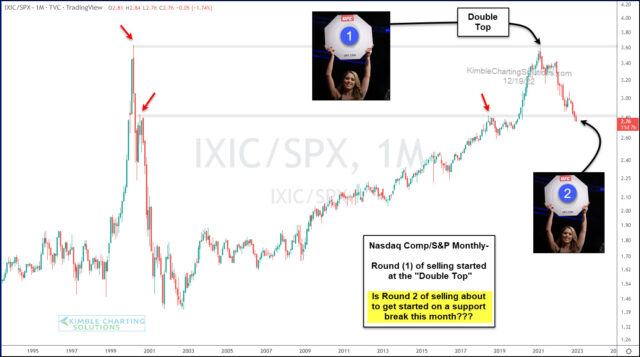
Today’s chart is a “monthly” chart of the performance ratio of the Nasdaq Composite to S&P 500 Index.
As you can see, it double topped before heading sharply lower. This marked round 1 of the tech bear market.
Currently, this important ratio is looking to break below important support (prior resistance). Closing the month below this support would be bearish and likely trigger round 2 of the tech bear market. Stay tuned!
This article was first written for See It Markets.com. To see the original post CLICK HERE.


